How To Find Frequency Of S Sine Graph
Kalali
Mar 14, 2025 · 5 min read
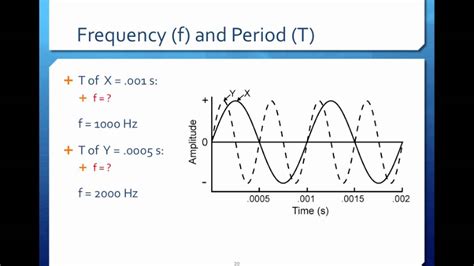
Table of Contents
How to Find the Frequency of a Sine Graph
Determining the frequency of a sine graph is a fundamental concept in mathematics and numerous scientific fields, including physics, engineering, and signal processing. Understanding frequency allows us to analyze cyclical patterns, predict future behavior, and extract valuable information from periodic data. This comprehensive guide will walk you through various methods for finding the frequency of a sine graph, from visual inspection to analytical techniques, ensuring you grasp the concept thoroughly.
Understanding Sine Waves and Frequency
Before delving into the methods, let's establish a clear understanding of sine waves and their frequency. A sine wave, represented by the equation y = A sin(ωt + φ), is a smooth, periodic oscillation. The key parameters are:
- A (Amplitude): The maximum displacement from the equilibrium position. It represents the height of the wave.
- ω (Angular Frequency): Represents the rate of change of the phase (in radians per unit time). It's directly related to frequency.
- t (Time): The independent variable, representing the time elapsed.
- φ (Phase Shift): Represents the horizontal shift of the wave.
Frequency (f) is the number of complete cycles the wave completes per unit of time. It's inversely proportional to the period (T), the time taken for one complete cycle. The relationship is:
f = 1/T
The angular frequency (ω) and frequency (f) are related by:
ω = 2πf
Therefore, finding the frequency involves determining either the period or the angular frequency from the sine graph.
Methods for Determining the Frequency
Several methods exist for determining the frequency of a sine graph, ranging from simple visual inspection to more complex analytical approaches.
1. Visual Inspection: The Period Method
This method is the simplest and most intuitive, especially for readily identifiable sine waves.
Steps:
- Identify one complete cycle: A complete cycle starts at a point on the wave, goes through a peak and a trough, and returns to a point with the same value and slope as the starting point.
- Measure the period (T): Determine the horizontal distance (usually in time units) between two corresponding points on consecutive cycles. This distance represents the period (T). You can measure this directly from the graph.
- Calculate the frequency (f): Use the formula
f = 1/T. Remember to use consistent units. If the period is measured in seconds, the frequency will be in Hertz (Hz), which represents cycles per second.
Limitations: This method is only accurate for clean, easily identifiable sine waves. Noise or overlapping signals can significantly hinder accurate visual measurement.
2. Analytical Method: Using the Equation
If you have the equation of the sine wave, determining the frequency becomes straightforward.
Steps:
- Identify the angular frequency (ω): The general equation of a sine wave is y = A sin(ωt + φ). Locate the coefficient of 't' within the sine function. This coefficient is the angular frequency (ω).
- Calculate the frequency (f): Use the formula
f = ω / 2π. This will directly provide the frequency in Hz.
Example:
Consider the equation y = 5 sin(10πt + π/2). The angular frequency (ω) is 10π. Therefore, the frequency (f) is:
f = (10π) / (2π) = 5 Hz
Advantages: This method provides a precise value for the frequency, irrespective of noise or complexity in the graph.
3. Using Software and Data Analysis Tools
For complex signals or when dealing with large datasets, software tools become invaluable.
Techniques:
-
Fast Fourier Transform (FFT): This is a powerful algorithm used to decompose a complex signal into its constituent frequencies. FFT is widely implemented in software packages like MATLAB, Python (with libraries like NumPy and SciPy), and dedicated signal processing software. The FFT output will show a spectrum of frequencies present in the signal; the peak corresponds to the dominant frequency.
-
Curve Fitting: Many software programs allow fitting a sine wave to experimental data. This fitting process will give you the best-fit equation of a sine wave, from which you can directly extract the frequency using the method described in section 2.
4. Digital Signal Processing (DSP) Techniques
For highly complex and noisy signals, advanced DSP techniques may be required. These techniques often involve pre-processing steps such as filtering, noise reduction, and signal conditioning before applying FFT or other frequency analysis methods. Specialized software and knowledge of DSP algorithms are necessary for these advanced techniques.
Dealing with Complex Scenarios
Several scenarios may add complexity to determining the frequency:
- Noisy Signals: Noise can obscure the true frequency. Filtering techniques, such as moving averages or more advanced digital filters, can help to smooth the data before analysis.
- Multiple Frequencies: A signal may contain multiple frequencies superimposed on each other. The FFT is particularly useful in these cases, revealing the presence and relative strength of different frequency components.
- Non-Sinusoidal Periodic Waves: While the methods discussed primarily apply to sine waves, similar principles can be applied to other periodic functions by finding their fundamental frequency. The Fourier series allows you to express any periodic function as a sum of sine and cosine waves, which are easier to analyze.
- Damped Oscillations: If the amplitude of the sine wave decreases over time (damped oscillation), the frequency might still be determined by focusing on the intervals between consecutive peaks or troughs in the early part of the oscillation where damping is minimal.
Practical Applications of Frequency Analysis
Determining the frequency of a sine graph has wide-ranging applications:
- Acoustics and Audio Engineering: Analyzing sound waves to determine their pitch and timbre.
- Electronics and Telecommunications: Analyzing electrical signals in circuits and communication systems.
- Mechanical Engineering: Studying vibrations and oscillations in mechanical systems.
- Medical Imaging: Analyzing signals from medical equipment like electrocardiograms (ECGs) and electroencephalograms (EEGs).
- Seismic Analysis: Studying earthquake waves and other geological phenomena.
Conclusion
Determining the frequency of a sine graph is a crucial skill across various scientific and engineering disciplines. This guide provides a comprehensive overview of different methods, from basic visual inspection to advanced digital signal processing techniques. Choosing the appropriate method depends on the complexity of the graph, the availability of tools, and the desired level of accuracy. Remember to always carefully consider the potential sources of error and apply appropriate techniques to mitigate their impact. Mastering frequency analysis is essential for anyone working with periodic signals and interpreting their meaning.
Latest Posts
Latest Posts
-
How Many Hours Is 136 Minutes
May 09, 2025
-
What Happens When An Oceanic And Oceanic Plate Collide
May 09, 2025
-
250 Is What Percent Of 300
May 09, 2025
-
What Temperature Is Ideal For Disease Producing Pathogens To Grow
May 09, 2025
-
How Many Cups Are In One Pint
May 09, 2025
Related Post
Thank you for visiting our website which covers about How To Find Frequency Of S Sine Graph . We hope the information provided has been useful to you. Feel free to contact us if you have any questions or need further assistance. See you next time and don't miss to bookmark.