How To Find The Velocity Of A Position Time Graph
Kalali
Mar 14, 2025 · 5 min read
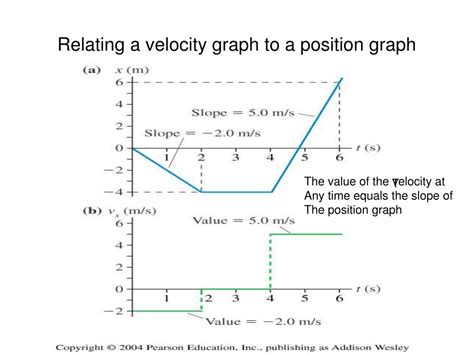
Table of Contents
How to Find the Velocity from a Position-Time Graph
Understanding how to extract velocity from a position-time graph is fundamental in physics and crucial for various applications, from analyzing projectile motion to understanding the movement of celestial bodies. This comprehensive guide will delve into the intricacies of determining velocity, covering different graph types, handling complexities like curves, and exploring practical applications. We'll equip you with the knowledge and skills to confidently interpret and analyze position-time graphs.
Understanding the Basics: Position, Time, and Velocity
Before we delve into the graphical analysis, let's briefly recap the core concepts:
-
Position (x or y): This represents the location of an object at a specific point in time. It's often measured in meters (m), kilometers (km), or other relevant units of distance.
-
Time (t): This is the independent variable, representing the moment at which the position is measured. It's typically measured in seconds (s), minutes (min), or hours (hr).
-
Velocity (v): This is the rate of change of position with respect to time. It tells us how fast and in what direction an object is moving. Velocity is a vector quantity, meaning it has both magnitude (speed) and direction. It's typically measured in meters per second (m/s) or other units of distance per unit of time.
The fundamental relationship between these quantities is:
Velocity (v) = Change in Position (Δx) / Change in Time (Δt)
This formula is the key to understanding how we extract velocity information from a position-time graph.
Analyzing Straight-Line Position-Time Graphs
The simplest case involves a straight-line position-time graph. The slope of this line directly represents the velocity.
Constant Velocity
A straight line with a positive slope indicates constant positive velocity (the object is moving in the positive direction at a constant speed). The steeper the slope, the greater the velocity.
A straight line with a negative slope indicates constant negative velocity (the object is moving in the negative direction at a constant speed). The steeper the slope, the greater the magnitude of the negative velocity.
A horizontal line (zero slope) indicates zero velocity; the object is stationary or at rest.
Calculating Velocity from a Straight Line:
To calculate the velocity, choose two points on the line (x₁, t₁) and (x₂, t₂). Then apply the formula:
v = (x₂ - x₁) / (t₂ - t₁)
Example:
Let's say we have two points on a position-time graph: (2s, 4m) and (6s, 12m).
v = (12m - 4m) / (6s - 2s) = 8m / 4s = 2 m/s
This indicates a constant velocity of 2 meters per second in the positive direction.
Analyzing Curved Position-Time Graphs
Curved position-time graphs represent situations where the velocity is not constant; it's changing over time. This indicates acceleration. The slope of the tangent to the curve at any given point gives the instantaneous velocity at that specific moment.
Finding Instantaneous Velocity
The instantaneous velocity is the velocity at a single point in time. It can be found by calculating the slope of the tangent line to the curve at that specific point. This often requires drawing a tangent line visually to estimate the slope, or using more advanced mathematical techniques like calculus (derivatives) for precise calculations. However, even visual estimation provides a valuable understanding of velocity changes.
Finding Average Velocity over an Interval
If we need the average velocity over a specific time interval on a curved graph, we calculate the slope of the secant line connecting the two points defining that interval. This provides the average velocity across the whole interval, not the velocity at any single instant.
Calculating Average Velocity from a Curve:
Similar to the straight-line case, choose two points (x₁, t₁) and (x₂, t₂) on the curve that define your interval. Then use the formula:
v_avg = (x₂ - x₁) / (t₂ - t₁)
Example:
On a curved graph, if we have points (1s, 2m) and (5s, 10m), the average velocity over that 4-second interval is:
v_avg = (10m - 2m) / (5s - 1s) = 8m / 4s = 2 m/s
Interpreting Velocity from Graph Shape and Slope
The shape of the position-time graph provides valuable insights into the object's motion:
-
Concave Up (Curve Opens Upwards): Indicates positive acceleration (velocity is increasing).
-
Concave Down (Curve Opens Downwards): Indicates negative acceleration (velocity is decreasing, or the object is decelerating).
-
Point of Inflection: The point where the concavity changes (from concave up to concave down or vice versa). At this point, the acceleration is zero, although the velocity might still be non-zero.
Advanced Techniques and Considerations
For more complex curves, particularly those described by mathematical functions, calculus (specifically, derivatives) is required to determine instantaneous velocity precisely. The derivative of the position function with respect to time provides the velocity function. For example, if the position function is x(t) = 2t² + 3t, the velocity function is v(t) = dx/dt = 4t + 3.
Furthermore, the concept of displacement versus distance traveled is vital. Displacement considers only the net change in position, while distance considers the total distance covered regardless of direction. The average velocity is based on displacement, while calculating the average speed would necessitate tracking the total distance.
Practical Applications
The ability to interpret position-time graphs has extensive practical applications across diverse fields:
-
Physics: Analyzing projectile motion, understanding simple harmonic motion, and investigating collisions.
-
Engineering: Designing and analyzing the movement of machinery, optimizing transportation systems, and studying fluid dynamics.
-
Astronomy: Tracking the orbits of celestial bodies, predicting planetary movements, and analyzing stellar kinematics.
-
Sports Science: Analyzing athlete performance, optimizing training strategies, and evaluating the effectiveness of different techniques.
Conclusion
Mastering the interpretation of position-time graphs is a critical skill in physics and related fields. By understanding the relationship between slope, velocity, and acceleration, you can extract valuable information about the motion of an object. Whether you are dealing with simple straight lines or complex curves, the fundamental principles outlined here provide a solid foundation for analyzing and interpreting these graphical representations of motion. Remember that the ability to accurately extract velocity information from position-time graphs is a powerful tool for understanding and predicting the movement of objects in a vast range of scenarios. Continue practicing and exploring different types of graphs to solidify your understanding and skills.
Latest Posts
Latest Posts
-
46 Inches Is How Many Feet
Mar 14, 2025
-
What Percent Is 12 Of 20
Mar 14, 2025
-
How Many Feet Is 40 M
Mar 14, 2025
-
How Many Miles Is A 6k
Mar 14, 2025
-
How Many Ml In 32 Ounces
Mar 14, 2025
Related Post
Thank you for visiting our website which covers about How To Find The Velocity Of A Position Time Graph . We hope the information provided has been useful to you. Feel free to contact us if you have any questions or need further assistance. See you next time and don't miss to bookmark.
