How To Find Velocity From A Position Time Graph
Kalali
Mar 13, 2025 · 6 min read
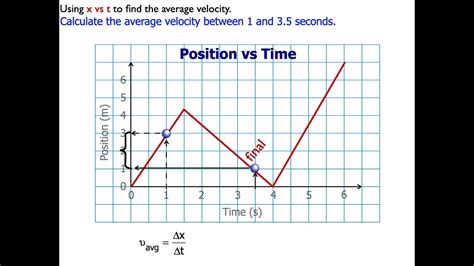
Table of Contents
How to Find Velocity from a Position-Time Graph: A Comprehensive Guide
Understanding the relationship between position, time, and velocity is fundamental in physics and many other fields. A position-time graph provides a visual representation of an object's movement, making it an invaluable tool for analyzing its motion. This comprehensive guide will walk you through various techniques to accurately determine velocity from a position-time graph, catering to different levels of understanding. We will explore both constant and changing velocities, covering scenarios with straight lines and curves, and emphasizing practical applications.
Understanding the Basics: Position, Time, and Velocity
Before diving into the specifics of interpreting graphs, let's solidify our understanding of the core concepts:
-
Position: This refers to the location of an object at a specific point in time. It's often measured relative to a reference point (e.g., origin).
-
Time: The independent variable, representing the duration of the object's movement.
-
Velocity: A vector quantity representing the rate of change of an object's position with respect to time. It includes both speed (magnitude) and direction. Average velocity considers the overall displacement over a time interval, while instantaneous velocity focuses on the velocity at a specific moment.
Interpreting Position-Time Graphs: The Foundation
A position-time graph plots position (usually on the y-axis) against time (on the x-axis). The slope of the line or curve at any point on the graph represents the velocity at that instant. Let's explore this in detail:
Straight Lines: Constant Velocity
When the graph shows a straight line, it indicates constant velocity. The slope of this line directly corresponds to the velocity:
-
Positive Slope: Indicates positive velocity; the object is moving in the positive direction (e.g., moving to the right or upwards).
-
Negative Slope: Indicates negative velocity; the object is moving in the negative direction (e.g., moving to the left or downwards).
-
Zero Slope (Horizontal Line): Indicates zero velocity; the object is stationary or at rest.
Calculating Velocity from a Straight Line:
The velocity (v) is calculated using the formula:
v = Δx / Δt
Where:
- Δx represents the change in position (final position - initial position).
- Δt represents the change in time (final time - initial time).
Example: If an object moves from x = 2 meters to x = 8 meters in 3 seconds, its velocity is (8m - 2m) / 3s = 2 m/s.
Curved Lines: Changing Velocity
A curved line on a position-time graph signifies a changing velocity – the object is accelerating or decelerating. The slope of the curve at any given point represents the instantaneous velocity at that precise moment.
Determining Instantaneous Velocity:
Determining the instantaneous velocity from a curved line requires finding the slope of the tangent line at the specific point of interest. A tangent line touches the curve at only one point and represents the instantaneous rate of change at that point.
Methods for Finding the Tangent Line's Slope:
-
Visual Estimation: For a rough approximation, draw a tangent line to the curve at the desired point using a ruler. Then, carefully choose two points on the tangent line and calculate the slope using the formula (Δx / Δt).
-
Numerical Methods (for more accuracy): More sophisticated methods, like numerical differentiation (e.g., finite difference methods), can provide a more precise estimation of the instantaneous velocity, especially when dealing with complex curves. These methods involve calculating the slope using points very close to the point of interest. This is typically done using software or programming tools.
Understanding Acceleration:
The rate at which velocity changes is called acceleration. A curved position-time graph implies acceleration. The curvature itself indicates the direction and magnitude of the acceleration. A steeper curve indicates higher acceleration.
Advanced Techniques and Applications
Let's delve into more advanced scenarios and practical applications of interpreting position-time graphs:
Displacement vs. Distance
It's crucial to differentiate between displacement and distance. Displacement is the change in position from the starting point to the ending point, regardless of the path taken. Distance is the total length of the path traveled. Velocity calculations use displacement, not distance.
Relative Velocity
When dealing with multiple objects moving relative to each other, their velocities must be considered relative to a common frame of reference. For example, if two cars are moving in opposite directions, their relative velocity will be the sum of their individual velocities.
Analyzing Real-World Scenarios
Position-time graphs are vital in various real-world applications:
-
Traffic Engineering: Analyzing traffic flow and identifying bottlenecks.
-
Sports Analytics: Studying athlete performance (e.g., speed and acceleration in running or swimming).
-
Robotics: Monitoring and controlling robot movements.
-
Astronomy: Tracking the motion of celestial bodies.
-
Physics Experiments: Analyzing experimental data and verifying theoretical models.
Practical Exercises and Examples
Let's solidify our understanding with a few practical examples:
Example 1: Constant Velocity
A car travels at a constant speed of 20 m/s for 10 seconds. Plot the position-time graph. What is the car's velocity?
Solution: The graph will be a straight line with a positive slope of 20 m/s. The velocity is simply 20 m/s.
Example 2: Changing Velocity
A ball is thrown vertically upwards. Its position is given by the equation y = 20t - 5t², where y is the height in meters and t is the time in seconds. Draw the position-time graph and determine the ball's velocity at t = 2 seconds.
Solution: Plot the given equation. To find the velocity at t=2 seconds, find the slope of the tangent line at t=2. This can be done either graphically or using calculus (differentiation). Using calculus, the velocity equation is found by taking the derivative of the position equation with respect to time: v = dy/dt = 20 - 10t. At t = 2 seconds, v = 20 - 10(2) = 0 m/s. This makes sense, as at the highest point of the ball's trajectory, the velocity is momentarily zero before it starts falling down.
Example 3: Analyzing a Complex Graph
Consider a position-time graph with multiple segments (straight lines and curves). Analyze the motion of the object during each segment, identifying periods of constant velocity, acceleration, and rest. Calculate the average velocity over the entire time interval.
Solution: Analyze each segment separately. For straight lines, calculate the slope to determine the velocity. For curved sections, visually estimate the slope of the tangent line at different points to determine instantaneous velocity. The average velocity for the entire interval is calculated by finding the total displacement divided by the total time.
Conclusion: Mastering Position-Time Graphs
Understanding how to extract velocity information from position-time graphs is a crucial skill in physics and many related fields. This guide has provided a comprehensive overview, from basic interpretations of straight lines to more advanced techniques for handling curved lines and analyzing real-world scenarios. By mastering these techniques, you will be well-equipped to analyze motion, solve problems, and interpret data effectively. Remember that practice is key—the more graphs you analyze, the better you'll become at interpreting the motion depicted. Don't hesitate to tackle various examples and exercises to reinforce your understanding. This will not only improve your problem-solving skills but also provide a solid foundation for understanding more complex concepts in physics and beyond.
Latest Posts
Latest Posts
-
If Your 35 What Year Was You Born
Jul 12, 2025
-
How Many Cups Is 1 Pound Of Cheese
Jul 12, 2025
-
30 X 30 Is How Many Square Feet
Jul 12, 2025
-
How Much Does A Half Oz Weigh
Jul 12, 2025
-
Calories In An Omelette With 3 Eggs
Jul 12, 2025
Related Post
Thank you for visiting our website which covers about How To Find Velocity From A Position Time Graph . We hope the information provided has been useful to you. Feel free to contact us if you have any questions or need further assistance. See you next time and don't miss to bookmark.