How To Make A Velocity Vs Time Graph
Kalali
Apr 01, 2025 · 6 min read
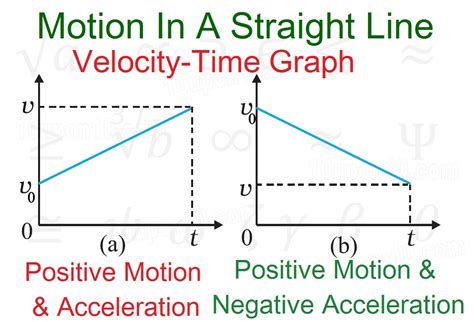
Table of Contents
How to Make a Velocity vs. Time Graph: A Comprehensive Guide
Understanding motion is fundamental in physics, and one of the best ways to visualize and analyze motion is through graphs. Specifically, a velocity vs. time graph provides a powerful tool for understanding an object's movement, acceleration, and displacement. This comprehensive guide will walk you through everything you need to know about creating and interpreting these crucial graphs.
Understanding the Fundamentals
Before diving into the creation of a velocity vs. time graph, let's solidify our understanding of the key concepts involved:
Velocity
Velocity is a vector quantity, meaning it possesses both magnitude (speed) and direction. A car traveling at 60 mph north has a different velocity than a car traveling at 60 mph south, even though their speeds are the same. In a velocity vs. time graph, the y-axis represents velocity.
Time
Time, unsurprisingly, is represented on the x-axis of the graph. It is always plotted as an independent variable, meaning its value isn't affected by the velocity.
Acceleration
Acceleration is the rate of change of velocity. A positive slope on a velocity vs. time graph indicates positive acceleration (increasing velocity), while a negative slope indicates negative acceleration (decreasing velocity or deceleration). A flat line (zero slope) represents constant velocity (zero acceleration).
Steps to Constructing a Velocity vs. Time Graph
Creating a velocity vs. time graph involves several steps:
-
Gather Data: The first crucial step is collecting accurate data. You'll need measurements of velocity at various points in time. This data can be obtained through various methods:
- Direct Measurement: Using tools like radar guns, motion sensors, or video analysis software to directly measure an object's velocity at specific time intervals.
- Calculation: If you know the displacement (change in position) and time intervals, you can calculate the average velocity using the formula:
velocity = displacement / time. - Experimental Data: Conducting experiments involving moving objects and recording their velocities and corresponding times.
-
Choose Your Axes: Draw a set of axes. Remember, the horizontal (x-axis) represents time, and the vertical (y-axis) represents velocity. Clearly label each axis with the appropriate units (e.g., seconds for time, meters per second for velocity). Choose an appropriate scale for each axis to ensure the graph is clear and easy to read. The scale should be consistent and allow for all data points to be plotted comfortably.
-
Plot the Data Points: Carefully plot each data point on the graph. Each point represents a specific velocity at a specific time. For example, if your data shows a velocity of 10 m/s at 2 seconds, you would plot a point at (2, 10) on the graph.
-
Draw the Line/Curve: Once all data points are plotted, determine the best way to connect them. The type of line or curve you draw will depend on the nature of the motion:
- Straight Line: A straight line indicates constant acceleration. The slope of this line gives the magnitude and sign of the acceleration.
- Curve: A curve indicates changing acceleration. The slope of the curve at any point represents the instantaneous acceleration at that point. You can approximate this by drawing a tangent line to the curve at that specific point.
-
Add a Title and Labels: Give your graph a descriptive title, such as "Velocity vs. Time Graph for a Rolling Ball" or "Velocity vs. Time Graph of a Car's Acceleration." Ensure your axes are clearly labeled with units (e.g., "Time (s)" and "Velocity (m/s)"). Including a legend can be helpful if you're plotting multiple datasets on the same graph.
Interpreting Velocity vs. Time Graphs
Once your graph is complete, you can use it to extract valuable information about the object's motion:
Determining Displacement
The area under the velocity-time curve represents the displacement of the object. For simple shapes like rectangles and triangles, calculating this area is straightforward. For more complex curves, numerical integration techniques may be necessary. Remember that the area above the x-axis represents positive displacement (movement in one direction), while the area below the x-axis represents negative displacement (movement in the opposite direction). The total displacement is the sum of these areas, considering their signs.
Identifying Acceleration
The slope of the velocity-time graph represents the acceleration. A positive slope means positive acceleration (increasing velocity), a negative slope means negative acceleration (decreasing velocity), and a zero slope (horizontal line) means zero acceleration (constant velocity).
Determining Instantaneous Velocity
The y-value of the graph at any given time represents the instantaneous velocity at that time.
Analyzing Different Motion Scenarios
Different types of motion will result in different shapes on the velocity-time graph:
- Constant Velocity: A horizontal straight line indicates constant velocity (zero acceleration).
- Constant Acceleration: A straight line with a non-zero slope indicates constant acceleration. The steeper the slope, the greater the acceleration.
- Changing Acceleration: A curved line indicates changing acceleration. The curvature of the line reflects the rate at which the acceleration is changing.
Advanced Considerations and Applications
While the basic principles outlined above cover the fundamentals, several advanced considerations can enhance your understanding and application of velocity vs. time graphs:
Dealing with Non-Uniform Motion
For scenarios involving non-uniform motion where acceleration isn't constant, the process becomes slightly more complex. You might need to employ numerical techniques like Riemann sums or trapezoidal rule to estimate the area under the curve, thereby approximating displacement. Alternatively, if you have a mathematical function describing the velocity as a function of time, you can use calculus (integration) to determine the exact displacement.
Multiple Objects and Comparative Analysis
Velocity vs. time graphs are excellent for comparing the motion of multiple objects. Plotting the velocity-time data for each object on the same graph allows for a direct visual comparison of their acceleration, displacement, and overall motion.
Applications in Real-World Scenarios
Velocity vs. time graphs have extensive applications in various fields:
- Engineering: Analyzing the motion of vehicles, projectiles, and other mechanical systems.
- Physics: Studying the motion of particles, celestial bodies, and other physical phenomena.
- Sports Science: Analyzing the performance of athletes by examining their velocity changes during activities like running or swimming.
- Traffic Engineering: Modeling traffic flow and optimizing traffic management strategies.
Conclusion
Creating and interpreting velocity vs. time graphs is a crucial skill in physics and related disciplines. By meticulously collecting data, accurately plotting points, and carefully analyzing the resulting graph, you can gain a deep understanding of an object's motion, including its acceleration, displacement, and changes in velocity over time. Mastering this skill enables you to visualize complex motion scenarios, compare different motions, and apply this knowledge to numerous real-world problems. Remember to always label your axes correctly, choose an appropriate scale, and provide a clear title to facilitate understanding and effective communication of your findings. The ability to analyze these graphs effectively opens doors to a deeper comprehension of the world around us, allowing for the application of scientific principles in various practical applications.
Latest Posts
Latest Posts
-
How Much Is 50 Degrees Celsius In Fahrenheit
Apr 02, 2025
-
How Many Inches Is 167 Cm
Apr 02, 2025
-
A Device Which Makes Work Easier Is Called A
Apr 02, 2025
-
15 Ounces Equals How Many Cups
Apr 02, 2025
-
32 5 Cm Is How Many Inches
Apr 02, 2025
Related Post
Thank you for visiting our website which covers about How To Make A Velocity Vs Time Graph . We hope the information provided has been useful to you. Feel free to contact us if you have any questions or need further assistance. See you next time and don't miss to bookmark.
