How To Tell If A Table Is Quadratic
Kalali
Mar 27, 2025 · 5 min read
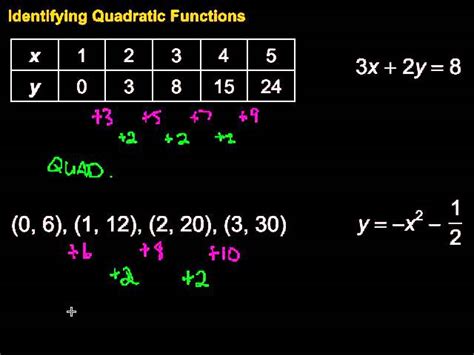
Table of Contents
How to Tell if a Table Represents a Quadratic Function
Determining whether a table of values represents a quadratic function requires a keen understanding of quadratic properties. While a simple visual inspection might suggest a quadratic relationship, a rigorous mathematical approach is necessary for definitive confirmation. This article will equip you with the tools and methods to confidently identify quadratic functions from tabular data.
Understanding Quadratic Functions
Before delving into identification techniques, let's solidify our understanding of quadratic functions. A quadratic function is a polynomial function of degree two, meaning the highest power of the independent variable (typically x) is 2. Its general form is:
f(x) = ax² + bx + c
where a, b, and c are constants, and a ≠ 0 (if a were 0, it wouldn't be a quadratic function, but rather a linear one). Key characteristics of quadratic functions include:
- Parabolic Graph: When graphed, they form a parabola – a symmetrical U-shaped curve.
- Constant Second Differences: This is a crucial characteristic we'll exploit to identify quadratic functions from tables.
Method 1: Analyzing Differences
This is the most reliable method for determining if a table represents a quadratic function. It leverages the property of constant second differences. Here's how it works:
Step 1: Calculate the First Differences
Start by calculating the differences between consecutive y-values (or function values). Let's illustrate with an example:
| x | y | First Difference |
|---|---|---|
| 0 | 2 | |
| 1 | 5 | 5 - 2 = 3 |
| 2 | 10 | 10 - 5 = 5 |
| 3 | 17 | 17 - 10 = 7 |
| 4 | 26 | 26 - 17 = 9 |
Step 2: Calculate the Second Differences
Now, repeat the process, calculating the differences between the first differences:
| x | y | First Difference | Second Difference |
|---|---|---|---|
| 0 | 2 | ||
| 1 | 5 | 3 | |
| 2 | 10 | 5 | 5 - 3 = 2 |
| 3 | 17 | 7 | 7 - 5 = 2 |
| 4 | 26 | 9 | 9 - 7 = 2 |
Step 3: Interpret the Results
Observe the second differences. If they are constant (in our example, they are all 2), then the table likely represents a quadratic function. If the second differences are not constant, the table does not represent a quadratic function. It might represent a linear function (constant first differences), an exponential function, or another type of function altogether.
Important Note: While constant second differences strongly suggest a quadratic relationship, it's not foolproof. If the x-values are not equally spaced, this method may not yield reliable results. In such cases, Method 2 (using the quadratic formula or regression) is preferred.
Method 2: Using the Quadratic Formula or Regression
This method is particularly useful when the x-values are not evenly spaced or when you need to determine the specific quadratic equation that fits the data.
Step 1: Assume a Quadratic Form
Start by assuming the data points follow the general form of a quadratic equation: y = ax² + bx + c
Step 2: Create a System of Equations
Select at least three data points from the table. Substitute their x and y values into the equation y = ax² + bx + c to create a system of three equations with three unknowns (a, b, c).
For example, if we use the points (0,2), (1,5), and (2,10) from our previous example:
- Equation 1: 2 = a(0)² + b(0) + c => c = 2
- Equation 2: 5 = a(1)² + b(1) + c
- Equation 3: 10 = a(2)² + b(2) + c
Step 3: Solve the System of Equations
Solve the system of equations to find the values of a, b, and c. This can be done using various methods, such as substitution, elimination, or matrix methods. For our example:
Substituting c = 2 into equations 2 and 3:
- 5 = a + b + 2
- 10 = 4a + 2b + 2
Solving this system (e.g., using substitution or elimination) gives: a = 1, b = 2, c = 2.
Step 4: Verify the Solution
Once you've solved for a, b, and c, substitute these values back into the general quadratic equation: y = x² + 2x + 2.
Check if this equation accurately predicts the y-values for all the points in the table. If it does, then the table represents a quadratic function. If not, then it’s not a quadratic. The discrepancy could stem from experimental errors in the data.
Step 5: Using Regression Analysis
For a larger dataset or for greater accuracy, regression analysis (using statistical software or a calculator) is recommended. Perform a quadratic regression on the data. The resulting R² value indicates the goodness of fit. A high R² value (close to 1) suggests a strong quadratic relationship.
Method 3: Graphing the Data (Visual Inspection)
While not a definitive method, graphing the data points can provide a visual clue. If the points appear to fall along a parabola, it suggests a quadratic relationship. However, this method is susceptible to error, especially with limited data points or noisy data. It's crucial to combine this with one of the other methods for a definitive answer.
Handling Irregularities and Noise in Data
Real-world data often contains noise or inconsistencies. Slight deviations from perfect constant second differences don’t necessarily invalidate the quadratic nature of the data. Consider these points:
- Experimental Error: Small variations in second differences might arise from experimental errors or measurement limitations.
- Data Truncation: Rounding off numbers can also lead to minor inconsistencies.
If the second differences are nearly constant, but not perfectly so, consider the context of the data and the potential sources of error before concluding that the relationship is not quadratic.
Conclusion: A Multifaceted Approach
Identifying whether a table of values represents a quadratic function requires a rigorous and multifaceted approach. While analyzing second differences offers a quick and effective method for many cases, using the quadratic formula or regression analysis provides a more robust and precise solution, particularly when dealing with unevenly spaced data points, large datasets, or potential noise in the data. Combining these analytical methods with visual inspection through graphing enhances confidence in your conclusions. Remember to always consider the context of the data and potential sources of error in your interpretation. Through a combination of mathematical analysis and careful consideration, you can confidently determine the nature of the relationships within your data.
Latest Posts
Latest Posts
-
If Im 65 What Year Was I Born
Jul 04, 2025
-
How Many Sheets Of 7 16 Osb In A Unit
Jul 04, 2025
-
How Much Is 79 Kg In Pounds
Jul 04, 2025
-
One Drink Equals In The Eyes Of Law Enforcement
Jul 04, 2025
-
What Community Originated The Phrase Go Big Or Go Home
Jul 04, 2025
Related Post
Thank you for visiting our website which covers about How To Tell If A Table Is Quadratic . We hope the information provided has been useful to you. Feel free to contact us if you have any questions or need further assistance. See you next time and don't miss to bookmark.