Skewness Of Box And Whisker Plots
Kalali
Mar 30, 2025 · 7 min read
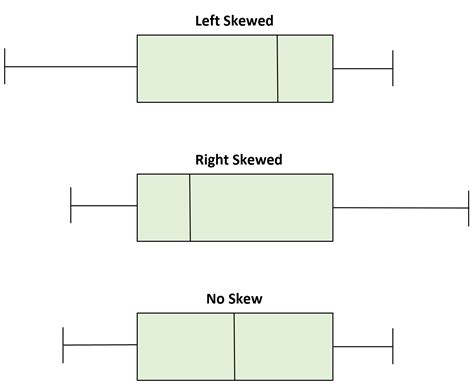
Table of Contents
Unveiling the Secrets of Skewness in Box and Whisker Plots
Box and whisker plots, also known as box plots, are invaluable tools in descriptive statistics. They provide a concise visual summary of a dataset's distribution, highlighting key features like central tendency, spread, and, crucially, skewness. Understanding skewness in box plots is vital for interpreting data accurately and drawing meaningful conclusions. This comprehensive guide will delve deep into the intricacies of skewness as depicted by box plots, explaining how to identify it, interpret its implications, and utilize this knowledge for insightful data analysis.
Understanding Skewness: A Quick Recap
Before diving into the specifics of box plots, let's establish a firm grasp on the concept of skewness. Skewness refers to the asymmetry of a probability distribution. A perfectly symmetrical distribution, like a normal distribution, has a skewness of zero. However, most real-world datasets exhibit some degree of asymmetry.
-
Positive Skewness (Right Skewness): The tail of the distribution extends further to the right. This indicates that there are more data points clustered towards the lower end of the range, with a few extreme values pulling the mean towards the higher end.
-
Negative Skewness (Left Skewness): The tail extends further to the left. This signifies a concentration of data points at the higher end, with a few extreme low values dragging the mean downwards.
Identifying Skewness in Box and Whisker Plots
Box plots offer a visual representation of skewness through the relative positions of the median, quartiles, and whiskers. While not a precise numerical measure like Pearson's moment coefficient of skewness, a box plot provides a quick and intuitive assessment.
Visual Cues of Skewness:
-
Median Position: In a symmetrical distribution, the median will be located roughly in the center of the box. However, in a skewed distribution, the median will be shifted towards the shorter side of the box.
-
Quartile Distances: The distance between the median and the first quartile (Q1) can be compared to the distance between the median and the third quartile (Q3). In a positively skewed distribution, the distance between the median and Q3 will be larger than the distance between the median and Q1. Conversely, in negatively skewed distributions, the distance between the median and Q1 will be greater.
-
Whisker Lengths: The length of the whiskers, representing the spread of the data beyond the quartiles, also provides clues. In positive skewness, the right whisker (extending to the maximum value) tends to be longer than the left whisker (extending to the minimum value). The opposite is true for negative skewness.
-
Outliers: Outliers, points significantly outside the whiskers' range, can significantly influence the perception of skewness. Their presence and location can exaggerate or even mask the underlying skewness of the main data distribution.
Interpreting Skewness: What it Means for Your Data
The presence and direction of skewness provide valuable insights into the characteristics of your data and its potential implications for statistical analysis:
Implications of Positive Skewness:
- Long Right Tail: Suggests the presence of high values that are less frequent than lower values.
- Mean > Median: The mean is pulled towards the higher end by the outliers.
- Potential for Outliers: More likely to have outliers on the right side of the distribution.
- Analysis Considerations: Techniques that are sensitive to outliers (e.g., certain types of regression analysis) might be affected. Median or other robust measures of central tendency might be preferable to the mean.
Implications of Negative Skewness:
- Long Left Tail: Indicates the presence of low values that are less common than higher values.
- Mean < Median: The mean is pulled down by the outliers.
- Potential for Outliers: More likely to have outliers on the left side of the distribution.
- Analysis Considerations: Similar to positive skewness, consider using robust statistical methods less susceptible to the influence of outliers.
Beyond Visual Inspection: Quantitative Measures of Skewness
While box plots offer a quick visual assessment, for a more precise quantification of skewness, other methods exist:
-
Pearson's Moment Coefficient of Skewness: A common method that utilizes the mean, median, and standard deviation to calculate a numerical measure of skewness. A value of 0 indicates symmetry, positive values suggest positive skewness, and negative values suggest negative skewness.
-
Bowley's Skewness: An alternative measure that is less sensitive to extreme values than Pearson's coefficient. It uses the quartiles to calculate skewness.
These numerical measures provide a more objective assessment of skewness, complementing the visual insights gained from box plots. However, remember that the box plot itself remains a powerful tool for visualizing the overall distribution and the interplay between skewness and other aspects of the data.
Using Box Plots to Compare Skewness Across Different Datasets
One of the significant strengths of box plots lies in their ability to facilitate the comparison of skewness across multiple datasets simultaneously. By plotting several box plots side-by-side, you can readily compare the distribution characteristics, including skewness, of different groups or treatments. This comparative analysis enables the identification of potentially significant differences in the underlying distributions.
For instance, consider comparing the income distributions of various demographic groups. By plotting box plots for each group, one can quickly visually assess differences in central tendency, spread, and importantly, skewness. A visibly greater rightward skew in one group compared to others might indicate a higher concentration of high-income individuals within that specific group.
Addressing Skewness in Data Analysis
Depending on the nature of your analysis and the severity of the skewness, several approaches can be used to manage its impact:
-
Data Transformation: Transforming the data using mathematical functions (e.g., logarithmic, square root, or reciprocal transformations) can sometimes reduce skewness and improve the normality of the distribution. This can be particularly helpful if the data needs to meet the assumptions of certain statistical tests.
-
Robust Statistical Methods: Employing statistical methods less sensitive to outliers and skewness is another strategy. For example, using the median instead of the mean as a measure of central tendency, or applying non-parametric tests rather than parametric tests.
-
Acknowledging and Interpreting Skewness: Sometimes, the best approach is simply to acknowledge the presence of skewness and interpret the results accordingly. The skewed nature of the data is an important characteristic that should be considered when drawing conclusions.
Case Studies: Illustrating Skewness in Real-World Data
Let's explore a couple of scenarios where understanding skewness through box plots is crucial:
Case Study 1: Analyzing House Prices
Imagine analyzing house prices in a particular city. A box plot of the data might reveal a significant positive skew. This indicates that while most houses fall within a certain price range, a few extremely expensive houses pull the average price upward. This skewness highlights the importance of using the median house price, a more robust measure, as opposed to the mean, which is overly influenced by the high-end outliers.
Case Study 2: Evaluating Customer Satisfaction Scores
Consider a survey measuring customer satisfaction. A box plot of the scores might show a negative skew, with a concentration of high scores and a few low scores. This suggests that most customers are happy, but there's a small segment expressing significant dissatisfaction. This highlights the need to investigate the reasons behind these low scores to improve customer service and address potential issues.
Conclusion: Mastering Skewness for Meaningful Data Interpretation
Skewness is a crucial aspect of data distribution that significantly impacts data analysis and interpretation. Box and whisker plots offer a valuable visual tool for identifying and understanding skewness. By combining the visual insights from box plots with a deeper understanding of skewness's implications and potential mitigation strategies, you can improve the accuracy and robustness of your statistical analyses. Remember to always consider the context of your data and choose appropriate analytical methods that account for the presence and nature of skewness. This approach will lead to more reliable and insightful conclusions from your data, ultimately leading to more informed decision-making.
Latest Posts
Latest Posts
-
160 Degrees Celsius Is What In Fahrenheit
Apr 01, 2025
-
62 C Is What In F
Apr 01, 2025
-
Which Type Of Mutation Stops The Translation Of Mrna
Apr 01, 2025
-
500 Mg Is Equal To How Many Grams
Apr 01, 2025
-
What Is The Percent By Mass Of Sodium In Nacl
Apr 01, 2025
Related Post
Thank you for visiting our website which covers about Skewness Of Box And Whisker Plots . We hope the information provided has been useful to you. Feel free to contact us if you have any questions or need further assistance. See you next time and don't miss to bookmark.
