The Table Represents A Linear Function.
Kalali
Mar 22, 2025 · 6 min read
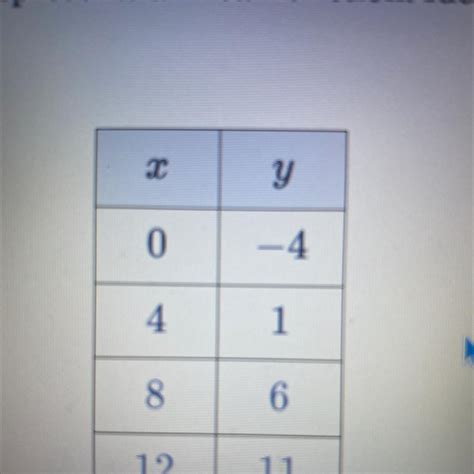
Table of Contents
The Table Represents a Linear Function: A Comprehensive Guide
Understanding linear functions is fundamental in mathematics and has wide-ranging applications in various fields. This article delves deep into the characteristics of linear functions, exploring how to identify them from a table of values, analyzing their properties, and showcasing real-world applications. We'll cover everything from the basic concepts to more advanced interpretations, making this a comprehensive guide for students and anyone interested in strengthening their mathematical understanding.
Identifying a Linear Function from a Table
The most straightforward way to determine if a table represents a linear function is to examine the constant rate of change. A linear function exhibits a consistent change in the dependent variable (usually 'y') for every unit change in the independent variable (usually 'x'). This constant rate of change is known as the slope (often represented by 'm').
Here's how to identify a linear function from a table:
-
Calculate the change in 'y' (Δy): Find the difference between consecutive y-values.
-
Calculate the change in 'x' (Δx): Find the difference between consecutive x-values.
-
Calculate the slope (m): Divide the change in 'y' by the change in 'x' (m = Δy/Δx).
-
Check for consistency: If the slope (m) remains constant for all consecutive pairs of points in the table, the table represents a linear function. If the slope varies, it's not a linear function.
Example:
Let's analyze this table:
| x | y |
|---|---|
| 1 | 3 |
| 2 | 5 |
| 3 | 7 |
| 4 | 9 |
-
Δy: 5-3 = 2, 7-5 = 2, 9-7 = 2
-
Δx: 2-1 = 1, 3-2 = 1, 4-3 = 1
-
m: 2/1 = 2, 2/1 = 2, 2/1 = 2
Since the slope remains constant at 2 for all pairs of points, this table represents a linear function.
Non-linear Function Example:
Consider this table:
| x | y |
|---|---|
| 1 | 1 |
| 2 | 4 |
| 3 | 9 |
| 4 | 16 |
-
Δy: 4-1 = 3, 9-4 = 5, 16-9 = 7
-
Δx: 2-1 = 1, 3-2 = 1, 4-3 = 1
-
m: 3/1 = 3, 5/1 = 5, 7/1 = 7
The slope is not constant; therefore, this table does not represent a linear function. This is a quadratic function.
Understanding the Equation of a Linear Function
Once you've confirmed that a table represents a linear function, you can determine its equation. The standard form of a linear equation is:
y = mx + c
where:
- y is the dependent variable.
- x is the independent variable.
- m is the slope (the constant rate of change).
- c is the y-intercept (the value of y when x = 0).
To find the equation, you need the slope (m) and the y-intercept (c). We already know how to find 'm' from the table. To find 'c', you can:
-
Use one point from the table and the slope: Substitute the values of x, y, and m into the equation y = mx + c and solve for c.
-
Extrapolate from the table: If the table includes x = 0, the corresponding y-value is the y-intercept. If not, extend the pattern to find the y-value when x = 0.
Example:
Using the linear function table from earlier (where m = 2):
Let's use the point (1, 3):
3 = 2(1) + c c = 1
Therefore, the equation of the linear function is: y = 2x + 1
Representing Linear Functions Graphically
Linear functions always produce a straight line when graphed on a coordinate plane. The slope (m) determines the steepness and direction of the line, while the y-intercept (c) determines where the line crosses the y-axis.
- Positive slope (m > 0): The line slopes upwards from left to right.
- Negative slope (m < 0): The line slopes downwards from left to right.
- Zero slope (m = 0): The line is horizontal.
- Undefined slope: The line is vertical (this is not a function in the strictest mathematical sense).
Plotting points from the table and connecting them with a straight line will visually represent the linear function.
Real-World Applications of Linear Functions
Linear functions are incredibly versatile and find application in numerous real-world scenarios:
1. Cost Analysis:
Many businesses use linear functions to model their costs. For example, the total cost of producing a product might be a linear function of the number of units produced. The slope represents the cost per unit, and the y-intercept represents fixed costs (costs that don't change with production volume).
2. Speed and Distance:
Constant speed scenarios are perfectly represented by linear functions. The distance traveled is a linear function of time. The slope represents the speed, and the y-intercept is the initial distance (often zero).
3. Temperature Conversion:
Converting between Celsius and Fahrenheit is a linear relationship. The formula itself is a linear equation.
4. Depreciation:
The value of an asset (like a car or computer) often depreciates linearly over time. A linear function can model this decline in value.
5. Simple Interest:
Simple interest calculations involve a linear relationship between the principal amount, interest rate, and time.
6. Proportional Relationships:
Many proportional relationships can be modeled with linear functions, where one variable is a constant multiple of another.
Advanced Concepts and Extensions
While the basics of identifying and representing linear functions from a table are relatively straightforward, several more advanced concepts build upon this foundation:
1. Piecewise Linear Functions:
These functions involve multiple linear segments. The function's behavior changes at specific points, creating a graph that's a series of connected line segments.
2. Systems of Linear Equations:
This involves solving for multiple unknown variables using multiple linear equations simultaneously. This often requires techniques like substitution or elimination.
3. Linear Inequalities:
Instead of an equals sign, these involve inequality symbols (<, >, ≤, ≥), resulting in shaded regions on a graph rather than a single line.
4. Linear Programming:
This optimization technique uses linear functions and inequalities to find the best possible solution (maximum or minimum) within certain constraints.
Conclusion
Identifying a linear function from a table is a crucial skill in mathematics. Understanding the constant rate of change (slope), deriving the equation, and visualizing the function graphically are essential steps. The wide-ranging applications of linear functions in various real-world scenarios highlight their importance in diverse fields. By mastering the concepts outlined in this article, you’ll build a strong foundation for tackling more advanced mathematical concepts and real-world problem-solving. Remember to practice regularly with different tables and examples to solidify your understanding. The more you practice, the more intuitive and efficient you'll become at working with linear functions.
Latest Posts
Latest Posts
-
How Much Protein In 8 Oz Of Chicken
Jul 04, 2025
-
R C Cola And A Moon Pie
Jul 04, 2025
-
If I Was 18 What Year Would I Be Born
Jul 04, 2025
-
One And Three Hundred Twenty Four Thousandths
Jul 04, 2025
-
How Much Is 2 Pounds Of Cream Cheese
Jul 04, 2025
Related Post
Thank you for visiting our website which covers about The Table Represents A Linear Function. . We hope the information provided has been useful to you. Feel free to contact us if you have any questions or need further assistance. See you next time and don't miss to bookmark.