What Does Mu Mean In Statistics
Kalali
Mar 30, 2025 · 6 min read
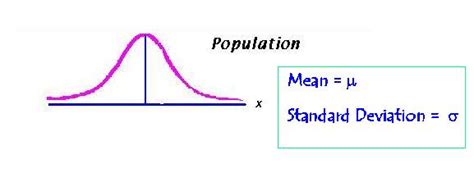
Table of Contents
What Does MU Mean in Statistics? Understanding the Population Mean
In the world of statistics, understanding notation is crucial for deciphering and interpreting data. One symbol that frequently appears is "µ," the Greek lowercase letter mu. This article will delve deep into the meaning of µ in statistics, exploring its significance, applications, and related concepts. We will unravel its connection to other statistical measures and highlight its importance in various statistical analyses.
Understanding the Population Mean (µ)
In statistics, µ (mu) represents the population mean. This is a crucial concept, forming the bedrock of many statistical analyses. Unlike the sample mean (denoted by x̄), which represents the average of a specific subset of data, the population mean represents the true average of the entire population being studied. This population could be anything from the height of all adult women in a country to the lifespan of a particular species of flower.
Key characteristics of the population mean (µ):
-
It's a parameter: A parameter is a numerical characteristic of a population. Unlike statistics, which are calculated from samples, parameters are fixed values that describe the entire population. Determining the true population mean often proves challenging, if not impossible, due to the practical limitations of studying every single element within a population.
-
It's a theoretical value: Often, we can only estimate the population mean based on sample data. We use statistical inference techniques to make educated guesses about the true value of µ.
-
It's calculated using all data points: The population mean is calculated by summing all values within the population and dividing by the total number of elements in that population.
Calculating the Population Mean: A Simple Example
Let's say we want to find the population mean (µ) of the ages of all five members of a family. The ages are: 45, 40, 15, 10, and 5.
The calculation is straightforward:
µ = (45 + 40 + 15 + 10 + 5) / 5 = 115 / 5 = 23
In this simplified example, we have the entire population data, so we can directly calculate the population mean. However, in most real-world scenarios, this is not feasible.
The Difference Between Population Mean (µ) and Sample Mean (x̄)
The distinction between the population mean (µ) and the sample mean (x̄) is pivotal. While both represent averages, they serve distinct purposes and have different implications in statistical analysis.
-
Population Mean (µ): Represents the average of the entire population. It's a fixed value (though often unknown) that describes the population characteristic.
-
Sample Mean (x̄): Represents the average of a subset (sample) drawn from the population. It's a calculated value that serves as an estimate of the population mean. The sample mean varies depending on the specific sample selected.
Why We Use Sample Means: The Reality of Data Collection
It's rarely practical or cost-effective to collect data from an entire population. Imagine trying to measure the height of every adult in a country! Instead, statisticians utilize sampling techniques to select a representative subset of the population. The sample mean, calculated from this sample, then provides an estimate of the population mean. The accuracy of this estimate depends on various factors, including the sample size and the sampling method employed.
Inferential Statistics and Estimating µ
Inferential statistics are statistical techniques used to draw conclusions about a population based on sample data. A core application of inferential statistics is estimating the population mean (µ).
Several methods exist for estimating µ:
-
Confidence Intervals: These provide a range of values within which the population mean is likely to fall, with a specified level of confidence (e.g., a 95% confidence interval).
-
Hypothesis Testing: This involves testing a specific claim or hypothesis about the population mean. For instance, we might test whether the population mean differs significantly from a particular value.
Central Limit Theorem and its Role in Estimation
The Central Limit Theorem (CLT) is a fundamental concept in statistics that plays a crucial role in estimating the population mean. It states that, under certain conditions, the distribution of sample means approaches a normal distribution as the sample size increases, regardless of the shape of the population distribution. This means that we can use the properties of the normal distribution to make inferences about the population mean, even if we don't know the true population distribution.
Applications of the Population Mean (µ) in Various Fields
The population mean finds extensive application across diverse fields:
-
Healthcare: Determining the average lifespan of individuals with a particular disease, assessing the average effectiveness of a new drug, or analyzing average patient recovery times.
-
Business: Calculating the average customer spending, assessing the average profit margin of a product, or determining the average employee salary.
-
Education: Analyzing the average test scores of students in a school district, evaluating the average GPA of college applicants, or comparing the average class sizes across different schools.
-
Environmental Science: Measuring the average concentration of pollutants in a water body, assessing the average rainfall in a region, or studying the average population size of an endangered species.
-
Social Sciences: Studying the average income levels in a community, analyzing the average age of marriage, or researching average voting patterns.
Related Statistical Measures and Their Relationship to µ
Several other statistical measures are closely related to the population mean:
-
Population Variance (σ²): Measures the spread or dispersion of the data around the population mean. A higher variance indicates greater variability.
-
Population Standard Deviation (σ): The square root of the population variance, providing a more interpretable measure of variability in the same units as the data.
-
Population Median: The middle value when the data is ordered. Unlike the mean, it is less sensitive to outliers.
-
Population Mode: The most frequently occurring value in the population.
Understanding the interplay between these measures is critical for a comprehensive understanding of the data. For instance, while the mean provides a measure of central tendency, the standard deviation quantifies the variability around that mean.
Conclusion: The Importance of µ in Statistical Analysis
The population mean (µ) is a fundamental concept in statistics, representing the true average of a population. While often unknown and estimated using sample data, understanding its meaning is crucial for interpreting statistical results and drawing valid conclusions. The concepts of sampling, inferential statistics, and the Central Limit Theorem are all interconnected and essential in our quest to estimate and understand this vital parameter. By grasping the nuances of µ and its relationship to other statistical measures, we gain a more powerful toolkit for analyzing data and making informed decisions across diverse fields. The significance of µ lies not just in its numerical value, but in its role as a cornerstone of statistical inference and a gateway to understanding the characteristics of populations. It's the unseen anchor that guides much of our statistical exploration and interpretation.
Latest Posts
Latest Posts
-
160 Degrees Celsius Is What In Fahrenheit
Apr 01, 2025
-
62 C Is What In F
Apr 01, 2025
-
Which Type Of Mutation Stops The Translation Of Mrna
Apr 01, 2025
-
500 Mg Is Equal To How Many Grams
Apr 01, 2025
-
What Is The Percent By Mass Of Sodium In Nacl
Apr 01, 2025
Related Post
Thank you for visiting our website which covers about What Does Mu Mean In Statistics . We hope the information provided has been useful to you. Feel free to contact us if you have any questions or need further assistance. See you next time and don't miss to bookmark.
