What Does Slope Of Vt Graph Represent
Kalali
Mar 10, 2025 · 5 min read
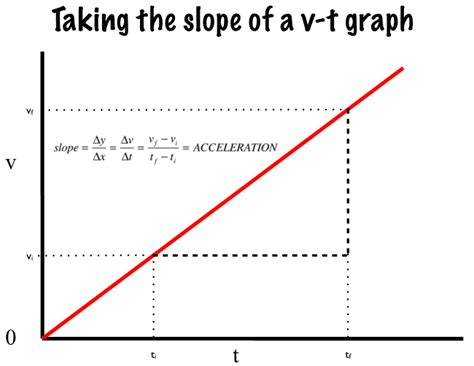
Table of Contents
What Does the Slope of a V-T Graph Represent? A Comprehensive Guide
Understanding graphs is fundamental to grasping the concepts of physics and motion. Among the most common graphs used to represent motion is the velocity-time (V-T) graph. This graph plots velocity on the y-axis and time on the x-axis. But what crucial information does the slope of a V-T graph reveal? This article dives deep into this question, exploring different scenarios and providing a comprehensive understanding of its significance.
Deciphering the Slope: Acceleration Unveiled
The most important piece of information revealed by the slope of a V-T graph is acceleration. The slope, calculated as the change in velocity divided by the change in time (Δv/Δt), directly represents the acceleration of an object.
Positive Slope: Positive Acceleration
A positive slope on a V-T graph indicates positive acceleration. This means the object's velocity is increasing over time. Imagine a car speeding up – its velocity is constantly rising, resulting in a positive slope on its V-T graph. The steeper the slope, the greater the acceleration; a gentle incline represents a smaller acceleration than a sharp incline.
Example: A cyclist starts from rest and steadily increases their speed. The V-T graph will show a straight line with a positive slope, representing a constant positive acceleration.
Negative Slope: Negative Acceleration (Deceleration)
A negative slope on a V-T graph signifies negative acceleration, often referred to as deceleration or retardation. This means the object's velocity is decreasing over time. Think of a car braking – its velocity decreases until it comes to a stop, producing a negative slope on its V-T graph. Again, the steepness of the slope indicates the magnitude of the deceleration; a steeper negative slope represents a greater deceleration.
Example: A ball thrown vertically upwards experiences negative acceleration due to gravity. Its V-T graph will show a straight line with a negative slope.
Zero Slope: Zero Acceleration (Constant Velocity)
A zero slope (a horizontal line) on a V-T graph indicates zero acceleration. This means the object's velocity is constant; it's neither speeding up nor slowing down. The object is moving at a uniform speed in a straight line.
Example: A train traveling at a constant speed of 60 mph on a straight track will have a horizontal line on its V-T graph, demonstrating zero acceleration.
Beyond the Basics: Interpreting Complex Scenarios
While the basic interpretation of the slope as acceleration is straightforward, V-T graphs can represent more complex motion scenarios.
Non-Linear Graphs: Changing Acceleration
If the V-T graph is not a straight line, it indicates that the acceleration is not constant. The slope of the curve at any point represents the instantaneous acceleration at that specific moment. This requires using calculus (derivatives) to find the precise acceleration at a given time.
Example: A rocket launching into space experiences a continuously changing acceleration as it burns fuel. The V-T graph for this would be a curve, with the slope constantly changing.
Area Under the Curve: Displacement
A remarkable feature of V-T graphs is that the area under the curve represents the displacement of the object. This is true regardless of whether the acceleration is constant or changing. For simple shapes like rectangles and triangles, the area can be easily calculated using geometrical formulas. For more complex curves, integration is required.
Example: To find the total distance traveled by a car represented by a V-T graph, one calculates the area enclosed between the curve and the time axis.
Understanding Units
It's crucial to understand the units involved. Velocity is usually measured in meters per second (m/s) or kilometers per hour (km/h), and time in seconds (s) or hours (h). Therefore, the units of acceleration (slope) are always units of velocity divided by units of time, such as m/s² or km/h².
Advanced Applications and Considerations
The interpretation of V-T graphs extends beyond simple linear motion and finds applications in diverse fields.
Projectile Motion: Analyzing Vertical and Horizontal Components
In projectile motion, separate V-T graphs can be drawn for the vertical and horizontal components of velocity. The vertical component usually shows a linear relationship with a constant negative acceleration due to gravity, while the horizontal component typically displays a constant velocity (zero acceleration) if air resistance is ignored.
Relativistic Motion: Limitations of Classical Mechanics
At very high speeds approaching the speed of light, the classical concepts of velocity and acceleration, as represented by simple V-T graphs, break down. Relativistic effects must be considered, necessitating a more complex framework for analyzing motion.
Practical Applications: Engineering and Automotive Industries
V-T graphs are invaluable tools in fields like engineering and the automotive industry. They help analyze the performance of vehicles, design safer braking systems, and optimize the efficiency of various mechanical systems.
Conclusion: A Powerful Tool for Understanding Motion
The slope of a V-T graph is a powerful tool for understanding and analyzing motion. Its simple yet insightful representation of acceleration provides a crucial understanding of how an object's velocity changes over time. Whether dealing with constant or changing acceleration, the slope, alongside the area under the curve, reveals fundamental information about an object's motion, offering valuable insights across diverse scientific and engineering applications. Mastering the interpretation of V-T graphs is essential for anyone seeking a deeper understanding of kinematics and its practical implications. By understanding the nuances of slope interpretation, one gains a significantly improved grasp of the dynamics of motion and can analyze real-world scenarios with greater accuracy and confidence. The principles discussed here provide a solid foundation for further exploration of more complex motion scenarios and applications.
Latest Posts
Latest Posts
-
How Many Bottles Of Water Is 1 Liter
Jul 14, 2025
-
How Many Days In A Million Minutes
Jul 14, 2025
-
How Many Days Is In 11 Weeks
Jul 14, 2025
-
How Many Grams Are In One Tola Gold
Jul 14, 2025
-
How Many Oz In A Pound Of Freon
Jul 14, 2025
Related Post
Thank you for visiting our website which covers about What Does Slope Of Vt Graph Represent . We hope the information provided has been useful to you. Feel free to contact us if you have any questions or need further assistance. See you next time and don't miss to bookmark.