What Does The Slope Of A Velocity Time Graph Represent
Kalali
Mar 10, 2025 · 5 min read
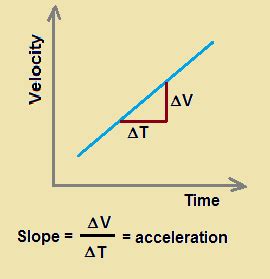
Table of Contents
What Does the Slope of a Velocity-Time Graph Represent? A Comprehensive Guide
Understanding motion is fundamental to physics, and graphs provide a powerful visual tool for analyzing it. Among these graphs, the velocity-time graph holds a special place, offering a concise way to represent an object's motion and extract crucial information. This article delves deep into the meaning and significance of the slope of a velocity-time graph, exploring its implications for acceleration, displacement, and various real-world scenarios.
Decoding the Slope: The Essence of Acceleration
The most important piece of information encoded within a velocity-time graph lies in its slope. Simply put, the slope of a velocity-time graph represents the acceleration of the object. This is a cornerstone concept in kinematics, the study of motion.
Let's break down why this is true:
-
Slope Defined: The slope of any line is calculated as the change in the y-axis value divided by the change in the x-axis value. In a velocity-time graph, the y-axis represents velocity (v) and the x-axis represents time (t). Therefore, the slope is calculated as:
Slope = (Change in velocity) / (Change in time) = Δv / Δt
-
Acceleration Defined: Acceleration is defined as the rate of change of velocity. This means it measures how quickly the velocity of an object is changing. The formula for acceleration (a) is:
a = Δv / Δt
-
The Connection: Notice the striking similarity between the formula for slope and the formula for acceleration. They are identical! This directly demonstrates that the slope of a velocity-time graph quantifies the acceleration of the object.
Interpreting Different Slopes: A Visual Guide
The slope's value and its sign carry significant meaning:
Positive Slope: Positive Acceleration
A positive slope on a velocity-time graph indicates positive acceleration. This means the object's velocity is increasing over time. The steeper the slope, the greater the acceleration. Imagine a car speeding up – its velocity-time graph would exhibit a positive slope.
Negative Slope: Negative Acceleration (Deceleration)
A negative slope signifies negative acceleration, often referred to as deceleration or retardation. The object's velocity is decreasing over time. This could represent a car slowing down or an object falling under the influence of gravity (assuming upward velocity is positive).
Zero Slope: Zero Acceleration (Constant Velocity)
A zero slope, represented by a horizontal line, means zero acceleration. The object's velocity remains constant; it's neither speeding up nor slowing down. This corresponds to uniform motion, where the object moves at a steady speed in a straight line.
Curved Line: Non-Uniform Acceleration
While the examples above focus on straight lines, it's important to note that the velocity of an object might not always change uniformly. A curved line on a velocity-time graph indicates non-uniform acceleration, meaning the acceleration itself is changing over time. The slope at any point on the curve represents the instantaneous acceleration at that specific moment. Calculating the acceleration in this case requires finding the slope of the tangent to the curve at the point of interest.
Beyond Slope: Extracting More Information from Velocity-Time Graphs
While the slope provides crucial information about acceleration, velocity-time graphs offer even more insights:
Calculating Displacement: The Area Under the Curve
The area under the velocity-time curve represents the displacement of the object. Displacement is the change in an object's position, considering both its magnitude and direction.
-
Rectangular Areas: For sections of the graph with constant velocity (horizontal lines), calculating the area is straightforward – it's simply the product of the velocity and the time interval.
-
Irregular Areas: For sections with non-uniform acceleration (curved lines), calculating the area requires more advanced techniques such as integration in calculus. However, approximation methods can be used for estimation.
Understanding Different Types of Motion
Velocity-time graphs provide a clear visualization of different types of motion:
- Uniform Motion: Represented by a horizontal line (constant velocity, zero acceleration).
- Uniformly Accelerated Motion: Represented by a straight line with a non-zero slope (constant acceleration).
- Non-Uniformly Accelerated Motion: Represented by a curved line (changing acceleration).
These visual representations allow for easy comparison and analysis of various types of motion.
Real-World Applications: Where the Slope Matters
The concepts of slope and area on velocity-time graphs find widespread application in various real-world situations:
- Automotive Engineering: Analyzing vehicle performance, braking systems, and acceleration capabilities.
- Projectile Motion: Studying the trajectory of projectiles, calculating maximum height, and range.
- Sports Science: Analyzing the performance of athletes, optimizing training regimens, and improving technique.
- Aerospace Engineering: Analyzing the flight paths of aircraft and spacecraft, determining optimal ascent and descent profiles.
- Accident Reconstruction: Determining the speed of vehicles involved in accidents based on skid marks and other evidence.
Advanced Concepts and Considerations
This discussion has primarily focused on one-dimensional motion. However, the principles can be extended to two or three dimensions, though the interpretation becomes more complex, often involving vector quantities and component analysis. Furthermore, considering concepts like impulse (change in momentum) and work-energy theorems adds another layer of depth to the analysis of motion using velocity-time graphs.
Conclusion: A Powerful Tool for Understanding Motion
The slope of a velocity-time graph is not merely a mathematical concept; it's a powerful tool for understanding and analyzing motion. Its ability to directly represent acceleration, combined with its capacity to reveal displacement through area calculations, makes it an indispensable resource in various fields of science and engineering. By mastering the interpretation of velocity-time graphs, one gains a profound understanding of the fundamental principles of motion and their applications in the real world. From analyzing the acceleration of a speeding car to predicting the trajectory of a projectile, the insights gained from understanding the slope of a velocity-time graph are invaluable. Understanding the relationship between slope, acceleration, and area is key to unlocking a deeper understanding of kinematics. This foundational knowledge empowers you to approach more complex physics concepts with confidence and proficiency. The seemingly simple velocity-time graph is a window into a world of motion, revealing its intricacies and offering a powerful tool for analysis and prediction.
Latest Posts
Latest Posts
-
What Is 30 Of 300 000
Mar 10, 2025
-
110 Cm In Inches And Feet
Mar 10, 2025
-
Mm To Thousandths Of An Inch
Mar 10, 2025
-
Is Snow A Liquid Or Solid
Mar 10, 2025
-
What Is 5 5 Feet In Cm
Mar 10, 2025
Related Post
Thank you for visiting our website which covers about What Does The Slope Of A Velocity Time Graph Represent . We hope the information provided has been useful to you. Feel free to contact us if you have any questions or need further assistance. See you next time and don't miss to bookmark.
