What Does The Slope Represent In A Velocity Time Graph
Kalali
Mar 10, 2025 · 5 min read
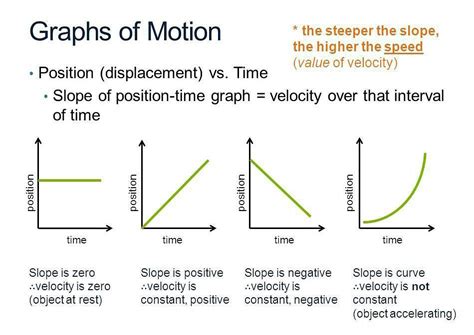
Table of Contents
What Does the Slope Represent in a Velocity-Time Graph? A Comprehensive Guide
Understanding motion is fundamental in physics, and graphs are powerful tools for visualizing and analyzing movement. Among these, the velocity-time graph stands out as a particularly insightful representation. But what does the slope of this graph truly signify? This comprehensive guide will delve deep into the meaning of the slope in a velocity-time graph, exploring its significance, calculations, and applications.
Understanding Velocity-Time Graphs
Before we delve into the slope's interpretation, let's establish a firm understanding of what a velocity-time graph represents. A velocity-time graph plots the velocity of an object on the y-axis against time on the x-axis. The graph provides a visual depiction of how an object's velocity changes over time. This allows us to easily analyze various aspects of the object's motion, including its acceleration, displacement, and overall movement pattern.
Key Features of a Velocity-Time Graph:
- Positive Velocity: Indicates movement in a positive direction (typically considered to the right or upwards).
- Negative Velocity: Represents movement in a negative direction (typically considered to the left or downwards).
- Zero Velocity: Shows the object is momentarily at rest.
- Slope of the Line: As we'll extensively explore, this is crucial and directly represents the object's acceleration.
- Area Under the Curve: This represents the object's displacement.
The Slope: The Key to Understanding Acceleration
The most critical piece of information gleaned from a velocity-time graph is the slope. The slope of a velocity-time graph represents the acceleration of the object. This fundamental relationship is the cornerstone of understanding motion analysis.
What is Acceleration?
Acceleration is defined as the rate of change of velocity. It signifies how quickly an object's velocity is increasing or decreasing. A positive acceleration means the velocity is increasing, while a negative acceleration (often called deceleration or retardation) indicates the velocity is decreasing. A constant slope indicates constant acceleration. A changing slope indicates changing acceleration.
Calculating Acceleration from the Slope
The acceleration can be calculated using the familiar formula for the slope of a line:
Acceleration (a) = (Change in Velocity) / (Change in Time) = (Δv) / (Δt)
Where:
- Δv represents the change in velocity (final velocity - initial velocity).
- Δt represents the change in time (final time - initial time).
This formula is directly derived from the definition of acceleration as the rate of change of velocity. If you have a velocity-time graph, you can find the slope by selecting two points on the line and applying this formula.
Different Slopes, Different Accelerations
Let's consider various scenarios and how the slope reflects the object's acceleration:
-
Positive Slope: A positive slope indicates a positive acceleration. This means the object's velocity is increasing over time. The steeper the slope, the greater the acceleration. Think of a car speeding up.
-
Zero Slope: A horizontal line (zero slope) indicates zero acceleration. The object's velocity is constant; it's moving at a uniform speed. Think of a car cruising at a constant speed on a highway.
-
Negative Slope: A negative slope indicates a negative acceleration (deceleration or retardation). The object's velocity is decreasing over time. The steeper the negative slope, the greater the deceleration. Think of a car braking to a stop.
-
Curved Line: If the line on the velocity-time graph is curved, it indicates a changing acceleration. This means the acceleration itself is not constant; it is either increasing or decreasing. Think of a rocket launching – its acceleration increases initially, then levels off.
Beyond the Basics: Analyzing Complex Motion
The interpretation of the slope extends beyond simple linear relationships. Let's explore more complex scenarios:
Non-linear Velocity-Time Graphs
Real-world motion is rarely represented by perfectly straight lines on a velocity-time graph. Often, the relationship between velocity and time is non-linear, resulting in a curved line. In these cases, the instantaneous acceleration at any given point can be found by calculating the slope of the tangent line to the curve at that specific point. This requires calculus (specifically, derivatives) for precise calculation. However, an approximation can be made using the slope of the secant line between two closely spaced points on the curve.
Area Under the Curve: Displacement
While the slope gives us acceleration, the area under the curve of a velocity-time graph provides another crucial piece of information: the displacement of the object. Displacement is the net change in the object's position from its starting point.
- Positive Area: Represents displacement in the positive direction.
- Negative Area: Represents displacement in the negative direction.
- Total Displacement: The sum of the positive and negative areas gives the total displacement.
Calculating the area under the curve might require different methods depending on the shape of the curve:
- Rectangles and Triangles: Simple geometric formulas can be used.
- Irregular Shapes: Numerical methods (such as the trapezoidal rule or Simpson's rule) are required for greater accuracy.
The combination of the slope (acceleration) and the area under the curve (displacement) provides a complete picture of an object's motion.
Practical Applications of Velocity-Time Graphs
The ability to interpret velocity-time graphs and understand their slopes has wide-ranging applications across various fields:
-
Physics: Fundamental to understanding kinematics and dynamics, crucial for analyzing projectile motion, collisions, and other mechanical systems.
-
Engineering: Used in designing vehicles, analyzing aircraft performance, and studying the motion of machinery.
-
Sports Science: Analyzing athlete performance, optimizing training techniques, and improving sports equipment.
-
Transportation: Planning transportation systems, optimizing traffic flow, and designing safer roadways.
Conclusion: The Slope's Significance
The slope of a velocity-time graph is not just a mathematical concept; it's a powerful tool for understanding and analyzing motion. Its direct representation of acceleration allows for a deep understanding of how an object's velocity changes over time. Combining this with the information obtained from the area under the curve (displacement), we gain a comprehensive view of the object's motion, paving the way for solving complex problems in various scientific and engineering disciplines. The ability to interpret these graphs is essential for anyone involved in the study or application of motion. From basic calculations to advanced analyses using calculus, mastering this skill opens doors to a deeper understanding of the physical world around us.
Latest Posts
Latest Posts
-
How Many Eighths In A Quarter Pound
Jul 18, 2025
-
Can The Sine Of An Angle Ever Equal 2
Jul 18, 2025
-
How Many Months Is A Hundred Days
Jul 18, 2025
-
Mother And I Or Mother And Me
Jul 18, 2025
-
How Many Oz In One Water Bottle
Jul 18, 2025
Related Post
Thank you for visiting our website which covers about What Does The Slope Represent In A Velocity Time Graph . We hope the information provided has been useful to you. Feel free to contact us if you have any questions or need further assistance. See you next time and don't miss to bookmark.