Which Equation Represents The Graphed Function
Kalali
Apr 06, 2025 · 6 min read
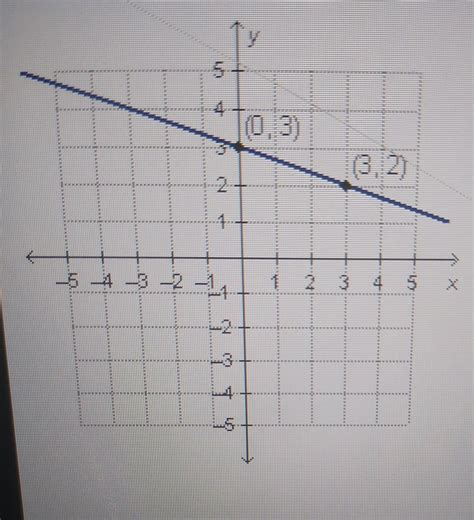
Table of Contents
Which Equation Represents the Graphed Function? A Comprehensive Guide
Determining the equation that represents a graphed function is a fundamental skill in algebra and precalculus. This process, often called function identification, involves analyzing key features of the graph, such as intercepts, asymptotes, vertex, and overall shape, to deduce the underlying algebraic representation. This guide will explore various approaches and techniques for solving this common mathematical problem, catering to different levels of understanding and function types.
Understanding the Fundamentals: Function Families
Before diving into specific examples, let's briefly review some common function families and their characteristic features. Recognizing the family to which a function belongs is the first crucial step in determining its equation.
1. Linear Functions (y = mx + b)
- Characteristics: Straight line, constant slope (m), y-intercept (b) where the line crosses the y-axis.
- Identification: Look for a straight line. The slope can be calculated using two points on the line: m = (y₂ - y₁) / (x₂ - x₁). The y-intercept is the y-coordinate where x = 0.
2. Quadratic Functions (y = ax² + bx + c)
- Characteristics: Parabola (U-shaped curve), vertex (minimum or maximum point), axis of symmetry (vertical line passing through the vertex).
- Identification: Look for a parabolic shape. The vertex can be found using the formula x = -b / 2a. The y-intercept is the point where x = 0 (c). The value of 'a' determines the parabola's direction (opens upwards if a > 0, downwards if a < 0).
3. Polynomial Functions (y = aₙxⁿ + aₙ₋₁xⁿ⁻¹ + ... + a₁x + a₀)
- Characteristics: Can have multiple turning points, x-intercepts (roots), degree 'n' determines the maximum number of turning points (n-1).
- Identification: Look for curves with multiple turning points. The degree of the polynomial can be determined by counting the number of turning points plus one. Finding the roots (x-intercepts) is crucial for determining the factors of the polynomial.
4. Exponential Functions (y = abˣ)
- Characteristics: Rapid increase or decrease, horizontal asymptote (a line the graph approaches but never touches).
- Identification: Look for a curve that increases or decreases rapidly. The horizontal asymptote usually lies on the x-axis (y=0) unless there's a vertical shift. The base 'b' determines the rate of growth or decay.
5. Logarithmic Functions (y = a logₓ(b))
- Characteristics: Slow increase or decrease, vertical asymptote (a line the graph approaches but never touches).
- Identification: Look for a curve that increases or decreases slowly. The vertical asymptote is typically the y-axis (x=0) unless there's a horizontal shift. The base 'b' determines the rate of growth or decay.
6. Rational Functions (y = P(x) / Q(x)) where P(x) and Q(x) are polynomials.
- Characteristics: May have vertical asymptotes (where the denominator is zero), horizontal asymptotes (determined by the degrees of the numerator and denominator), and oblique asymptotes (slant asymptotes).
- Identification: Look for curves with vertical asymptotes (breaks in the graph) and possible horizontal or oblique asymptotes. Analyzing the behavior of the function near the asymptotes is essential.
Methods for Determining the Equation
The specific method used to find the equation depends on the type of function and the information provided in the graph. Here are some common approaches:
1. Using Key Points and Slope (Linear Functions)
For linear functions, you need at least two points (x₁, y₁) and (x₂, y₂) on the line. Use the slope formula: m = (y₂ - y₁) / (x₂ - x₁) to find the slope (m). Then, use the point-slope form of the equation: y - y₁ = m(x - x₁) and simplify to the slope-intercept form (y = mx + b).
Example: If the line passes through points (1, 3) and (3, 7), then m = (7 - 3) / (3 - 1) = 2. Using the point (1, 3), the equation is y - 3 = 2(x - 1), which simplifies to y = 2x + 1.
2. Using the Vertex and a Point (Quadratic Functions)
For quadratic functions, finding the vertex (h, k) and another point (x, y) on the parabola is sufficient. Use the vertex form of the quadratic equation: y = a(x - h)² + k. Substitute the coordinates of the vertex and the other point to solve for 'a'.
Example: If the vertex is (2, 1) and the point (3, 4) lies on the parabola, then 4 = a(3 - 2)² + 1. Solving for 'a' gives a = 3. The equation is y = 3(x - 2)² + 1.
3. Using x-intercepts and a Point (Polynomial Functions)
For polynomial functions, finding the x-intercepts (roots) provides the factors of the polynomial. If a polynomial has roots r₁, r₂, ..., rₙ, then its equation can be written as y = a(x - r₁)(x - r₂)...(x - rₙ), where 'a' is a constant. Use another point on the graph to find 'a'.
Example: If a quadratic has x-intercepts at x = 1 and x = -2, and passes through the point (0, 2), the equation would be of the form y = a(x - 1)(x + 2). Substituting (0, 2), we get 2 = a(-1)(2), which means a = -1. The equation is y = -(x - 1)(x + 2).
4. Using Asymptotes and Points (Rational Functions)
For rational functions, identify the vertical asymptotes (values of x that make the denominator zero) and the horizontal asymptote (the value y approaches as x approaches infinity or negative infinity). Use points on the graph to determine the specific constants in the numerator and denominator.
Example: A rational function might have a vertical asymptote at x = 2 and a horizontal asymptote at y = 0. It might pass through (1,1). This suggests a form like y = k(x-a)/(x-2) where a is a constant and k is a constant determining the y-intercept. This information would require additional points or knowledge of its behaviour near the asymptotes to find k and a.
5. Recognizing Characteristic Shapes (Exponential and Logarithmic Functions)
Exponential and logarithmic functions have distinct shapes. Exponential functions exhibit rapid growth or decay, while logarithmic functions show a slow increase or decrease. Identifying the asymptotes and a few key points on the graph will help in determining the base and other constants in the equation. A graphing calculator can assist in refining estimates for 'a' and 'b' in equations like y = abˣ or y = a logₓ b.
Advanced Techniques and Considerations
- Graphing Calculators and Software: Tools like graphing calculators or software (like Desmos or GeoGebra) can help visualize the function and refine the equation by adjusting parameters.
- Transformations of Functions: Understanding how transformations (translations, reflections, stretches, and compressions) affect the graph can significantly aid in finding the equation.
- Systems of Equations: In some cases, you may need to set up a system of equations using multiple points on the graph to solve for the unknown coefficients in the equation.
- Numerical Methods: For complex functions, numerical methods (like regression analysis) might be necessary to approximate the equation.
Practice Makes Perfect
Mastering the skill of determining the equation of a graphed function requires consistent practice. Start with simpler linear and quadratic functions, then gradually progress to more complex polynomial, exponential, logarithmic, and rational functions. Utilize online resources, textbooks, and practice problems to hone your skills and build a strong understanding of function families and their corresponding equations. The more you practice, the quicker you'll become at recognizing patterns and efficiently determining the equation that accurately represents a given graph. Remember to always carefully analyze the key features of the graph to guide your selection of the appropriate method and function type.
Latest Posts
Latest Posts
-
What Is Half Of 1 And 3 4 Cup
Jul 02, 2025
-
How To Tell When Chorizo Is Done
Jul 02, 2025
-
Why Doesnt Christian Bale Remove His Mole
Jul 02, 2025
-
Somebody Once Told Me That The World Was Macaroni Lyrics
Jul 02, 2025
-
How Old Are You If Born In 1993
Jul 02, 2025
Related Post
Thank you for visiting our website which covers about Which Equation Represents The Graphed Function . We hope the information provided has been useful to you. Feel free to contact us if you have any questions or need further assistance. See you next time and don't miss to bookmark.