Which Equation Represents The Proportional Relationship In The Table
Kalali
Mar 18, 2025 · 5 min read
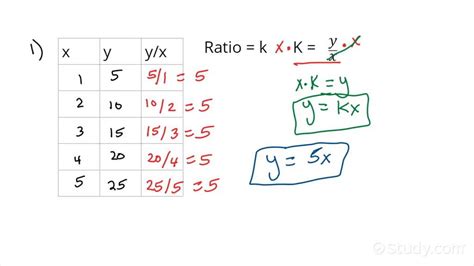
Table of Contents
Decoding Proportional Relationships: Which Equation Represents the Data?
Understanding proportional relationships is fundamental in mathematics and has widespread applications in various fields, from calculating ingredient ratios in cooking to analyzing economic trends. A proportional relationship exists between two variables when their ratio remains constant. This constant ratio is often referred to as the constant of proportionality or the unit rate. This article will delve into identifying proportional relationships from data presented in tables and determining the equation that accurately represents this relationship. We will explore various methods, including calculating the constant of proportionality, analyzing graphs, and understanding the structure of the equation itself.
What is a Proportional Relationship?
A proportional relationship, also known as a direct proportion, signifies that as one variable increases, the other variable increases proportionally, and vice-versa. The key characteristic is the constant ratio between the two variables. This constant ratio remains consistent regardless of the values chosen.
Example: Imagine you're buying apples. If 2 apples cost $1, then 4 apples would cost $2, 6 apples would cost $3, and so on. The ratio of apples to cost remains constant (2 apples/$1 = 2 apples/dollar). This consistent ratio signifies a proportional relationship.
Identifying Proportional Relationships from Tables
Data representing a proportional relationship in a table will always show a constant ratio between the two variables. To verify, we calculate the ratio of the dependent variable (usually represented by 'y') to the independent variable (usually represented by 'x') for each data point. If the ratios are consistent, we have a proportional relationship.
Example Table 1:
| x (Apples) | y (Cost in $) |
|---|---|
| 2 | 1 |
| 4 | 2 |
| 6 | 3 |
| 8 | 4 |
Calculations:
- 1/2 = 0.5
- 2/4 = 0.5
- 3/6 = 0.5
- 4/8 = 0.5
Since the ratio y/x remains constant at 0.5, this table represents a proportional relationship.
Example Table 2:
| x | y |
|---|---|
| 1 | 2 |
| 2 | 5 |
| 3 | 8 |
| 4 | 11 |
Calculations:
- 2/1 = 2
- 5/2 = 2.5
- 8/3 = 2.67
- 11/4 = 2.75
The ratio y/x is not constant. Therefore, this table does not represent a proportional relationship.
Determining the Equation of a Proportional Relationship
Once we've confirmed a proportional relationship, we can determine the equation. The general form of an equation representing a proportional relationship is:
y = kx
Where:
- y is the dependent variable
- x is the independent variable
- k is the constant of proportionality (the constant ratio we calculated earlier)
In Example Table 1, the constant ratio (k) was 0.5. Therefore, the equation representing the proportional relationship is:
y = 0.5x
This equation allows us to calculate the cost (y) for any number of apples (x).
Graphical Representation of Proportional Relationships
Proportional relationships are always represented by a straight line passing through the origin (0,0) on a graph. The slope of this line is equal to the constant of proportionality (k). This visual representation provides another way to confirm and understand the relationship. If the points plotted do not form a straight line passing through the origin, it's not a proportional relationship.
Dealing with More Complex Scenarios
While the examples above showcase simple scenarios, proportional relationships can be embedded within more complex problems. Consider the following:
Scenario: A car travels at a constant speed. The distance traveled (d) is proportional to the time (t). After 2 hours, the car has traveled 120 miles. What is the equation representing this relationship?
Solution:
- Identify the variables: d (distance) and t (time)
- Calculate the constant of proportionality: The car travels 120 miles in 2 hours, so the constant of proportionality (k) is 120 miles/2 hours = 60 miles/hour (the speed).
- Write the equation: d = 60t
This equation allows us to calculate the distance traveled for any given time.
Common Mistakes to Avoid
- Confusing correlation with causation: Just because two variables show a proportional relationship doesn't necessarily mean one causes the other. Correlation doesn't imply causation.
- Incorrectly identifying the constant of proportionality: Always ensure you are consistently calculating the ratio of y/x (or the appropriate variables) to find k.
- Ignoring the origin: In graphical representation, remember that a proportional relationship must pass through the origin (0,0).
Advanced Applications and Extensions
Understanding proportional relationships is crucial for solving various real-world problems across multiple disciplines:
- Physics: Calculating speed, distance, and time; understanding relationships between force, mass, and acceleration.
- Chemistry: Determining the ratios of reactants and products in chemical reactions.
- Engineering: Scaling designs and models; calculating stress and strain in materials.
- Economics: Analyzing supply and demand; understanding growth rates.
Real-World Examples
- Recipe Scaling: If a recipe calls for 2 cups of flour and 1 cup of sugar, the ratio of flour to sugar is 2:1. This is a proportional relationship; you can scale the recipe up or down while maintaining this ratio.
- Unit Pricing: Comparing prices of different sizes of the same product. If a 12-ounce can of soda costs $1.50, and a 24-ounce can costs $3.00, the unit price is constant, indicating a proportional relationship.
- Fuel Efficiency: The distance a car travels is directly proportional to the amount of fuel consumed (assuming constant speed and driving conditions).
Conclusion
Identifying and understanding proportional relationships is a crucial skill in mathematics and has wide-ranging practical applications. By consistently calculating the ratio between variables, graphing the data, and understanding the structure of the equation y = kx, we can accurately represent and utilize these relationships to solve a variety of problems. Remember to always check for consistency in the ratio and ensure the graphical representation passes through the origin to confidently identify a proportional relationship. Mastering this concept provides a strong foundation for more advanced mathematical concepts and problem-solving in various disciplines. Always meticulously analyze your data to prevent common errors and ensure accurate representation of the proportional relationship.
Latest Posts
Latest Posts
-
Temperate Deciduous Forest Oak Tree Adaptations
Mar 19, 2025
-
What Animals Can See Human Bioluminescence
Mar 19, 2025
-
Is Sour Taste A Physical Property
Mar 19, 2025
-
How Many Kilos Are 20 Pounds
Mar 19, 2025
-
11 Out Of 30 As A Percentage
Mar 19, 2025
Related Post
Thank you for visiting our website which covers about Which Equation Represents The Proportional Relationship In The Table . We hope the information provided has been useful to you. Feel free to contact us if you have any questions or need further assistance. See you next time and don't miss to bookmark.
