Which Graph Represents A Function With Direct Variation
Kalali
Mar 26, 2025 · 6 min read
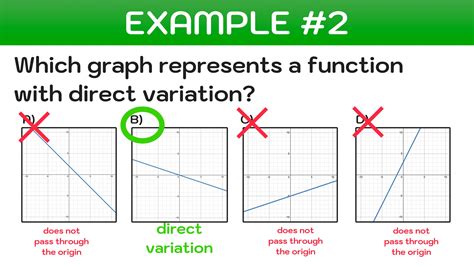
Table of Contents
Which Graph Represents a Function with Direct Variation?
Understanding direct variation is crucial in mathematics and various real-world applications. This article delves deep into the concept of direct variation, explaining what it is, how to identify it, and, most importantly, how to visually recognize it on a graph. We'll explore different types of graphs and analyze which ones depict a function exhibiting direct variation.
Understanding Direct Variation
Direct variation describes a relationship between two variables where one is a constant multiple of the other. In simpler terms, if one variable increases, the other increases proportionally, and if one decreases, the other decreases proportionally. This relationship can be represented mathematically as:
y = kx
Where:
- y and x are the two variables.
- k is the constant of variation (or constant of proportionality). This constant determines the rate at which y changes with respect to x. It's crucial to note that k cannot be zero. If k=0, then y would always be 0 regardless of x, resulting in a horizontal line through the origin, but not a direct variation.
This equation dictates that the ratio of y to x remains constant for all values of x and y. Therefore, y/x = k. This constant ratio is a key characteristic to look for when identifying direct variation.
Examples of Direct Variation in Real Life
Many real-world scenarios exhibit direct variation. Consider these examples:
- Distance and Speed: If you drive at a constant speed, the distance you cover is directly proportional to the time spent driving. The constant of variation here is your speed.
- Cost and Quantity: The total cost of buying identical items is directly proportional to the number of items purchased. The constant of variation is the price per item.
- Earnings and Hours Worked: If you earn a fixed hourly wage, your total earnings are directly proportional to the number of hours worked. The constant of variation is your hourly rate.
Identifying Direct Variation on a Graph
The visual representation of direct variation on a graph is straightforward. It always manifests as a straight line that passes through the origin (0, 0). This is because when x = 0, y must also equal 0, according to the equation y = kx. Any graph that doesn't satisfy this condition doesn't represent a direct variation.
Let's examine why this is the case:
- Straight Line: The constant ratio (k) ensures a linear relationship between x and y. Every unit change in x results in a consistent change in y, determined by k.
- Passing Through the Origin: The origin (0, 0) is a crucial point. As stated before, when x=0, y MUST be 0. A line that does not intersect the origin signifies a different type of relationship, possibly a linear relationship with a y-intercept, but not direct variation.
Distinguishing Direct Variation from Other Relationships
It's important to differentiate direct variation from other relationships that might appear similar on a graph:
-
Linear Functions with a Y-Intercept: A linear function of the form y = mx + c, where c is the y-intercept (a non-zero constant), is not a direct variation. Even though it's a straight line, it doesn't pass through the origin. The ratio y/x is not constant in this case.
-
Nonlinear Relationships: Parabolas, exponential curves, and other nonlinear functions clearly don't represent direct variation. These curves don't maintain a constant ratio between y and x.
-
Inverse Variation: Inverse variation, where y = k/x, is another type of relationship. Its graph is a hyperbola, completely different from the straight line representing direct variation.
Analyzing Different Graph Types
Let's analyze several graph types to solidify our understanding of which ones represent direct variation:
1. Straight Line Passing Through the Origin
This is the defining characteristic. If a graph shows a straight line that intersects the origin (0, 0), it strongly suggests a direct variation. You can further confirm this by checking if the ratio y/x is constant for different points on the line.
Example: A graph showing a line passing through points (1, 2), (2, 4), and (3, 6). The ratio y/x is consistently 2, indicating a direct variation with k = 2. The equation of the line is y = 2x.
2. Straight Line Not Passing Through the Origin
This graph does not represent direct variation. The presence of a y-intercept means the relationship is linear but not directly proportional. The ratio y/x will not be constant.
Example: A graph showing a line passing through points (0, 1), (1, 3), and (2, 5). This line has a y-intercept of 1, indicating it's not a direct variation. The equation would be y = 2x + 1.
3. Curved Lines (Parabolas, Exponential Curves, etc.)
Curved lines of any type do not represent direct variation. These graphs indicate nonlinear relationships where the ratio y/x is not constant.
4. Scatter Plots
Scatter plots can sometimes suggest a direct variation if the points cluster closely around a straight line passing through the origin. However, a perfect straight line is needed for definitive confirmation. Statistical analysis might be needed to determine if the correlation is strong enough to suggest direct variation.
Practical Application: Determining Direct Variation from Data
Often, you'll be presented with data points instead of a ready-made graph. To determine if the data represents direct variation, follow these steps:
- Plot the points: Create a scatter plot of the data points.
- Check for a straight line: Observe if the points appear to lie on a straight line.
- Verify the origin: Ensure the line (if it exists) passes through the origin (0, 0).
- Calculate the ratio y/x: Choose several points and calculate the ratio y/x for each. If the ratio is consistently the same (or very close, accounting for potential measurement errors), this indicates a direct variation.
Advanced Considerations: Dealing with Non-Linear Data
While direct variation implies a linear relationship, real-world data might not always be perfectly linear. In such cases, techniques like linear regression can be used to find the best-fitting line and determine if the data approximates a direct variation. The closer the R-squared value is to 1 in a linear regression analysis, the better the fit and the stronger the suggestion of an approximate direct variation. However, remember that even a good fit doesn't guarantee true direct proportionality – it only suggests a close approximation.
Conclusion: Visualizing Direct Variation
Identifying direct variation on a graph is relatively straightforward. The key is to look for a straight line that unequivocally passes through the origin (0, 0). If the graph fulfills these criteria, and the ratio y/x is constant, you can confidently conclude that the graph represents a function with direct variation. Remember to distinguish direct variation from other linear or nonlinear relationships. This understanding is crucial for applying the concept to various real-world problems and interpreting data effectively. Through careful analysis of the graph and application of the principles discussed above, you can confidently identify functions that exhibit this important mathematical relationship.
Latest Posts
Latest Posts
-
How Many Oz Are In 250 Ml
Mar 29, 2025
-
What Is 24 Inches In Feet
Mar 29, 2025
-
Convert 60 Degrees F To C
Mar 29, 2025
-
What Percentage Is 5 Out Of 6
Mar 29, 2025
-
Cuanto Es 50 Grados Fahrenheit En Centigrados
Mar 29, 2025
Related Post
Thank you for visiting our website which covers about Which Graph Represents A Function With Direct Variation . We hope the information provided has been useful to you. Feel free to contact us if you have any questions or need further assistance. See you next time and don't miss to bookmark.
