Which Graph Represents A Geometric Sequence
Kalali
Mar 13, 2025 · 5 min read
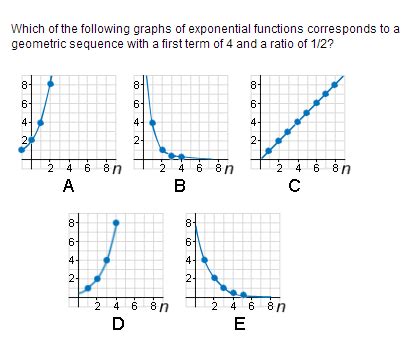
Table of Contents
Which Graph Represents a Geometric Sequence? A Comprehensive Guide
Understanding geometric sequences and their graphical representations is crucial in various fields, from mathematics and finance to computer science and engineering. This comprehensive guide will delve deep into the characteristics of geometric sequences and definitively answer the question: which graph represents a geometric sequence? We’ll explore the defining features, differentiate them from arithmetic sequences, and illustrate how to identify them visually.
Understanding Geometric Sequences
A geometric sequence is a sequence of numbers where each term after the first is found by multiplying the previous one by a constant, non-zero value. This constant value is called the common ratio, often denoted by 'r'. The general formula for a geometric sequence is:
a<sub>n</sub> = a<sub>1</sub> * r<sup>(n-1)</sup>
Where:
- a<sub>n</sub> is the nth term in the sequence.
- a<sub>1</sub> is the first term in the sequence.
- r is the common ratio.
- n is the term number.
Let's illustrate with an example. Consider the sequence: 2, 6, 18, 54, 162…
Here:
- a<sub>1</sub> = 2
- r = 3 (each term is multiplied by 3 to get the next)
Using the formula, we can find any term in the sequence. For example, the 5th term (n=5) would be:
a<sub>5</sub> = 2 * 3<sup>(5-1)</sup> = 2 * 3<sup>4</sup> = 162
Distinguishing Geometric Sequences from Arithmetic Sequences
It's crucial to differentiate geometric sequences from arithmetic sequences. In an arithmetic sequence, each term is obtained by adding a constant value (the common difference) to the previous term. The key difference lies in the operation: multiplication in geometric sequences and addition in arithmetic sequences.
Arithmetic Sequence Example: 2, 5, 8, 11, 14… (common difference = 3)
Geometric sequences exhibit exponential growth or decay, while arithmetic sequences show linear growth or decay. This difference is strikingly evident when represented graphically.
Graphical Representation of Geometric Sequences
The graph of a geometric sequence is not a straight line like an arithmetic sequence. Instead, it exhibits a characteristic exponential curve. This curve can be either increasing (if r > 1) or decreasing (if 0 < r < 1). If r < 0, the sequence alternates between positive and negative values, still following an exponential pattern. Let's break down the different possibilities:
1. Increasing Geometric Sequence (r > 1)
When the common ratio is greater than 1, the terms of the sequence increase exponentially. The graph will show a steep upward curve, starting at a<sub>1</sub> and rapidly increasing as n increases. The curve will never become perfectly vertical, but its slope will continuously increase.
2. Decreasing Geometric Sequence (0 < r < 1)
When the common ratio is between 0 and 1, the terms of the sequence decrease exponentially. The graph will show a curve that starts at a<sub>1</sub> and approaches zero asymptotically. It will never actually reach zero, but it gets increasingly closer as n approaches infinity.
3. Alternating Geometric Sequence (r < 0)
When the common ratio is negative, the terms alternate between positive and negative values. The graph will still exhibit an exponential pattern, but it will oscillate above and below the x-axis. The magnitude of the terms will either increase or decrease depending on the absolute value of r, following the same principles as positive r values.
Key Visual Characteristics to Identify a Geometric Sequence Graph:
- Curved Line: A geometric sequence will always be represented by a curve, not a straight line.
- Exponential Growth/Decay: The rate of increase or decrease is not constant; it accelerates or decelerates exponentially.
- Asymptotic Behavior (for 0 < r < 1): If the sequence is decreasing, the curve will approach the x-axis but never touch it.
- Alternating Signs (for r < 0): The graph oscillates above and below the x-axis.
How to Determine if a Graph Represents a Geometric Sequence
Given a graph, here's how to determine if it represents a geometric sequence:
- Check for a Curve: The most immediate indicator is a curved line, not a straight line.
- Analyze the Rate of Change: Observe how the y-values change as the x-values increase. If the rate of change is not constant but accelerates or decelerates, it suggests an exponential relationship.
- Look for Asymptotic Behavior: If the curve approaches a horizontal asymptote (a line it gets increasingly close to but never touches), it's a strong indication of a decreasing geometric sequence.
- Check for Alternating Signs: If the curve oscillates above and below the x-axis, it points towards a negative common ratio.
If these characteristics are present, it's highly likely the graph represents a geometric sequence. You can further confirm this by trying to calculate the common ratio by dividing consecutive y-values. If the ratio is approximately constant, your conclusion is further strengthened.
Real-World Applications of Geometric Sequences
Geometric sequences are not just abstract mathematical concepts; they have numerous real-world applications:
- Finance: Compound interest calculations rely heavily on geometric sequences. The accumulated amount grows exponentially over time.
- Population Growth: In idealized scenarios, population growth can be modeled using geometric sequences, especially when the growth rate is constant.
- Radioactive Decay: The decay of radioactive materials follows a geometric sequence, with the amount of remaining material decreasing exponentially over time.
- Computer Science: Algorithmic analysis often involves geometric sequences, especially in problems related to recursion and divide-and-conquer algorithms.
- Spread of Diseases (under specific conditions): In certain epidemiological models, the spread of infectious diseases can initially be approximated using geometric sequences.
Conclusion
Identifying the graphical representation of a geometric sequence involves recognizing its key characteristics: a curved line, exponential growth or decay, potential asymptotic behavior, and alternating signs for negative common ratios. Understanding these features allows you to distinguish it from other sequences, such as arithmetic sequences, and apply this knowledge to real-world problems across various disciplines. By mastering this concept, you gain valuable insights into exponential relationships and their impact on diverse phenomena. Remember to always check for a consistent common ratio to definitively confirm whether a graph indeed represents a geometric sequence.
Latest Posts
Latest Posts
-
How Many Days In A Million Minutes
Jul 14, 2025
-
How Many Days Is In 11 Weeks
Jul 14, 2025
-
How Many Grams Are In One Tola Gold
Jul 14, 2025
-
How Many Oz In A Pound Of Freon
Jul 14, 2025
-
How Many Years Are In A Millennia
Jul 14, 2025
Related Post
Thank you for visiting our website which covers about Which Graph Represents A Geometric Sequence . We hope the information provided has been useful to you. Feel free to contact us if you have any questions or need further assistance. See you next time and don't miss to bookmark.