Which Graph Represents An Exponential Function
Kalali
Mar 29, 2025 · 6 min read
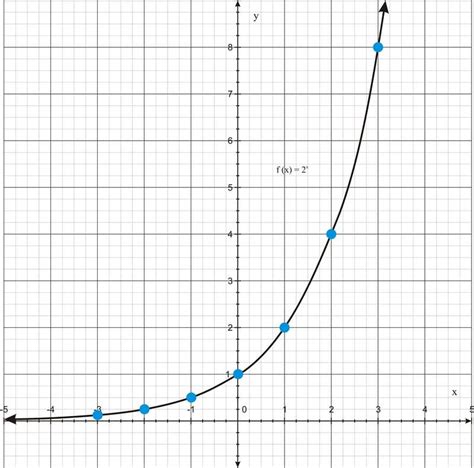
Table of Contents
Which Graph Represents an Exponential Function? A Comprehensive Guide
Understanding exponential functions is crucial in various fields, from finance and biology to computer science and physics. But how do you visually identify an exponential function from its graph? This comprehensive guide will equip you with the knowledge to confidently distinguish exponential functions from other types of functions based solely on their graphical representation. We'll explore the key characteristics of exponential graphs, compare them to other functions, and provide examples to solidify your understanding.
Key Characteristics of Exponential Function Graphs
An exponential function is a function of the form f(x) = a<sup>x</sup>, where 'a' is a positive constant (a > 0, and a ≠ 1). The key characteristics that distinguish its graph are:
1. Asymptotic Behavior:
- Horizontal Asymptote: This is the most defining characteristic. Exponential functions always have a horizontal asymptote. This means the graph approaches a specific horizontal line but never actually touches or crosses it. For functions of the form f(x) = a<sup>x</sup>, this asymptote is the x-axis (y = 0) if a > 1, and it is also the x-axis if 0 < a < 1. If we are dealing with a transformed exponential function (e.g., shifted up or down), the asymptote will be shifted accordingly.
- No Vertical Asymptote: Unlike some functions like rational functions, exponential functions do not possess vertical asymptotes. They are continuous across their entire domain (all real numbers).
2. Monotonicity:
- Increasing or Decreasing: Exponential functions are strictly monotonic. This means they are either strictly increasing or strictly decreasing across their entire domain. If a > 1, the function is strictly increasing (as x increases, f(x) increases). If 0 < a < 1, the function is strictly decreasing (as x increases, f(x) decreases). This means the graph will never "turn around" or change direction.
3. Growth/Decay Rate:
- Rapid Growth or Decay: The defining feature of exponential functions is their rapid growth or decay rate. For a > 1, the function grows increasingly faster as x increases. For 0 < a < 1, the function decays increasingly faster as x increases. This rapid change is significantly different from linear or polynomial functions.
4. Passing Through (0,1):
- y-intercept: For a basic exponential function f(x) = a<sup>x</sup>, the graph always passes through the point (0, 1). This is because any number raised to the power of 0 is equal to 1 (a<sup>0</sup> = 1). This point remains consistent regardless of the value of 'a' (as long as a > 0 and a ≠ 1). Transformations of the basic function will shift this point.
Distinguishing Exponential Graphs from Other Function Types
It's important to understand how exponential functions differ visually from other types of functions. Let's examine some common comparisons:
1. Linear Functions:
Linear functions have the form f(x) = mx + b, where 'm' is the slope and 'b' is the y-intercept. Their graphs are straight lines with a constant slope. Unlike exponential functions, linear functions have a constant rate of change and do not exhibit asymptotic behavior. A straight line immediately distinguishes it from the curves characteristic of exponential functions.
2. Quadratic Functions:
Quadratic functions have the form f(x) = ax² + bx + c. Their graphs are parabolas – symmetrical curves with a single vertex. While quadratic functions can exhibit rapid increases or decreases, they do not have horizontal asymptotes and are not monotonic over their entire domain. The parabolic shape is distinctly different from the consistently increasing or decreasing curve of an exponential function.
3. Polynomial Functions:
Polynomial functions are functions of the form f(x) = a<sub>n</sub>x<sup>n</sup> + a<sub>n-1</sub>x<sup>n-1</sup> + ... + a<sub>1</sub>x + a<sub>0</sub>, where 'n' is a non-negative integer. Higher-degree polynomials can exhibit complex curves with multiple turning points (local maxima and minima). However, they do not generally possess horizontal asymptotes, unlike exponential functions, and their rate of growth or decay is significantly different.
4. Logarithmic Functions:
Logarithmic functions are the inverse of exponential functions. While they have a vertical asymptote, and increase or decrease monotonically, their rate of change differs significantly from exponential functions. Logarithmic functions increase or decrease much more slowly than exponential functions. The shapes of the curves are mirror images of each other.
5. Trigonometric Functions:
Trigonometric functions (like sine, cosine, and tangent) are periodic functions. They repeat their values over a specific interval. Unlike exponential functions, they do not exhibit asymptotic behavior (except for tangent which has vertical asymptotes) and are not strictly monotonic. Their oscillating nature immediately sets them apart from the consistently increasing or decreasing behavior of exponential functions.
Examples and Illustrations
Let's illustrate the differences with some graphical examples. Imagine plotting the following functions:
- f(x) = 2<sup>x</sup> (Exponential, a > 1, increasing)
- f(x) = (1/2)<sup>x</sup> (Exponential, 0 < a < 1, decreasing)
- f(x) = x + 2 (Linear)
- f(x) = x² - 4 (Quadratic)
(Imagine graphs here – You would include carefully drawn graphs of each function clearly showing their key features: asymptotes, intercepts, monotonicity, and overall shape. For an article, visual aids would be indispensable.)
By comparing these graphs visually, you'll observe the distinct characteristics discussed earlier. The exponential functions will show their horizontal asymptote, monotonic nature, and rapid growth or decay. The linear function will be a straight line, and the quadratic function will be a parabola.
Transformations of Exponential Functions
The basic form of an exponential function, f(x) = a<sup>x</sup>, can be transformed in several ways, altering its graph:
- Vertical Shifts: Adding a constant 'k' to the function (f(x) = a<sup>x</sup> + k) shifts the graph vertically upwards by 'k' units. This shifts the horizontal asymptote as well.
- Horizontal Shifts: Replacing 'x' with (x - h) (f(x) = a<sup>(x-h)</sup>) shifts the graph horizontally to the right by 'h' units.
- Vertical Stretches/Compressions: Multiplying the function by a constant 'c' (f(x) = ca<sup>x</sup>) stretches the graph vertically if |c| > 1 and compresses it if 0 < |c| < 1.
- Reflections: Negating the function (f(x) = -a<sup>x</sup>) reflects the graph across the x-axis, while negating 'x' (f(x) = a<sup>-x</sup>) reflects it across the y-axis.
These transformations modify the location and scale of the graph, but the fundamental characteristics of an exponential function (horizontal asymptote, monotonicity, and rapid growth/decay) remain intact.
Real-World Applications
Exponential functions model many real-world phenomena:
- Population Growth: The growth of a population (bacteria, animals, humans) under ideal conditions can often be modeled using an exponential function.
- Radioactive Decay: The decay of radioactive substances follows an exponential pattern.
- Compound Interest: The growth of money in a savings account with compound interest is an exponential process.
- Spread of Diseases: In the early stages, the spread of infectious diseases can sometimes be modeled using exponential functions.
Understanding the graphical representation of exponential functions is crucial for interpreting and analyzing these real-world scenarios.
Conclusion
Identifying an exponential function from its graph requires recognizing its unique characteristics: the horizontal asymptote, monotonic behavior, rapid growth or decay, and the point (0,1) for the basic form. By comparing these traits with other function types, you can confidently distinguish exponential graphs and appreciate their significance in various applications. Remember to consider the impact of transformations on the basic exponential function graph when analyzing real-world data. With practice and a clear understanding of these key concepts, you'll become proficient in identifying exponential functions through their graphical representations.
Latest Posts
Latest Posts
-
How Do I Send An Evite Reminder
Jul 15, 2025
-
When Performing A Self Rescue When Should You Swim To Shore
Jul 15, 2025
-
How Many Decaliters Are In A Liter
Jul 15, 2025
-
What Note Sits In The Middle Of The Grand Staff
Jul 15, 2025
-
Did Lynette Shave Her Head In Real Life
Jul 15, 2025
Related Post
Thank you for visiting our website which covers about Which Graph Represents An Exponential Function . We hope the information provided has been useful to you. Feel free to contact us if you have any questions or need further assistance. See you next time and don't miss to bookmark.