Which Graph Represents The Rational Function
Kalali
Mar 15, 2025 · 6 min read
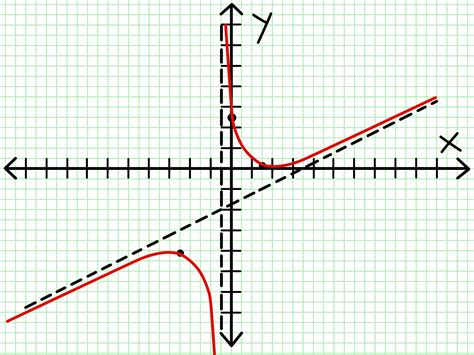
Table of Contents
Decoding Rational Functions: Which Graph Represents Them?
Understanding which graph represents a rational function is crucial for anyone studying algebra, pre-calculus, or calculus. Rational functions, characterized by their unique properties and behaviors, offer a rich landscape of mathematical exploration. This comprehensive guide will delve deep into identifying the graphical representations of rational functions, exploring their key features, and providing practical examples to solidify your understanding.
What is a Rational Function?
A rational function is defined as the ratio of two polynomial functions, where the denominator polynomial is not identically zero. In simpler terms, it's a fraction where both the numerator and the denominator are polynomials. The general form is:
f(x) = P(x) / Q(x)
where:
P(x)andQ(x)are polynomial functions.Q(x)≠ 0 (the denominator cannot be zero)
Understanding this basic definition is the first step in visualizing the graphs of these functions. The behavior near points where the denominator is zero is especially important, as it leads to key features of the graph.
Key Features of Rational Function Graphs
Several key features help us distinguish a rational function's graph from other function types. These include:
1. Vertical Asymptotes
A vertical asymptote is a vertical line (x = a) that the graph approaches but never touches. These occur wherever the denominator, Q(x), equals zero and the numerator, P(x), is not zero at that same x-value. To find vertical asymptotes:
- Set the denominator equal to zero: Q(x) = 0
- Solve for x: This gives you the x-coordinates of the vertical asymptotes.
- Check the numerator: Ensure P(x) is not zero at these x-values. If both P(x) and Q(x) are zero, further investigation is needed (see removable discontinuities below).
Example: In the function f(x) = (x+1)/(x-2), the vertical asymptote is at x = 2 because the denominator is zero at x=2, and the numerator is not zero at x=2.
2. Horizontal Asymptotes
A horizontal asymptote is a horizontal line (y = b) that the graph approaches as x approaches positive or negative infinity. The existence and location of horizontal asymptotes depend on the degrees of the numerator and denominator polynomials:
- Degree of P(x) < Degree of Q(x): The horizontal asymptote is y = 0.
- Degree of P(x) = Degree of Q(x): The horizontal asymptote is y = (leading coefficient of P(x)) / (leading coefficient of Q(x)).
- Degree of P(x) > Degree of Q(x): There is no horizontal asymptote; instead, there might be an oblique (slant) asymptote.
Example: In f(x) = (2x + 1)/(x - 3), the degree of the numerator and denominator are equal, so the horizontal asymptote is y = 2/1 = 2.
3. Oblique (Slant) Asymptotes
When the degree of the numerator is exactly one greater than the degree of the denominator, an oblique asymptote exists. To find it, perform polynomial long division of P(x) by Q(x). The quotient (ignoring the remainder) represents the equation of the oblique asymptote.
Example: In f(x) = (x² + 2x + 1) / (x + 1), performing long division yields x + 1. Therefore, the oblique asymptote is y = x + 1.
4. x-intercepts
x-intercepts are points where the graph crosses the x-axis (y = 0). To find them:
- Set the numerator equal to zero: P(x) = 0
- Solve for x: These values of x are the x-intercepts, provided they don't also make the denominator zero.
Example: In f(x) = (x + 1)(x - 3) / (x - 2), the x-intercepts are x = -1 and x = 3.
5. y-intercepts
The y-intercept is the point where the graph crosses the y-axis (x = 0). To find it:
- Set x = 0: Evaluate f(0). This gives you the y-coordinate of the y-intercept, provided that f(0) is defined (denominator is not zero).
Example: In f(x) = (x + 1) / (x - 2), the y-intercept is f(0) = -1/2.
6. Removable Discontinuities (Holes)
A removable discontinuity, or hole, occurs when both the numerator and denominator have a common factor that cancels out. This results in a "hole" in the graph at the x-value where the canceled factor equals zero.
Example: Consider f(x) = (x² - 4) / (x - 2). This simplifies to f(x) = (x + 2) for x ≠ 2. There's a hole at x = 2, because the (x-2) factor cancels, but the function is undefined at x=2.
Analyzing Graphs of Rational Functions: Step-by-Step Guide
-
Identify the Vertical Asymptotes: Find the values of x where the denominator is zero and the numerator is non-zero. Draw vertical dashed lines at these x-values.
-
Identify the Horizontal or Oblique Asymptotes: Determine the degrees of the numerator and denominator. Use the rules outlined above to find the horizontal or oblique asymptote(s) and draw horizontal or slant dashed lines accordingly.
-
Find the x-intercepts: Set the numerator equal to zero and solve for x. Plot these points on the x-axis.
-
Find the y-intercept: Evaluate f(0) to find the y-intercept and plot this point on the y-axis.
-
Check for Removable Discontinuities: Factor the numerator and denominator. If there are common factors that cancel, identify the x-value where the canceled factor is zero. This is the location of a hole. Indicate the hole with an open circle on the graph.
-
Sketch the Graph: Using the information gathered, sketch the graph, ensuring it approaches the asymptotes and passes through the intercepts and holes. You might need to test points in the intervals determined by the vertical asymptotes to determine the behavior of the graph in each section.
Examples of Rational Function Graphs
Let's analyze a few examples to visualize these concepts:
Example 1: f(x) = 1/(x - 2)
- Vertical Asymptote: x = 2
- Horizontal Asymptote: y = 0
- x-intercept: None
- y-intercept: (0, -1/2)
- Removable Discontinuities: None
Example 2: f(x) = (x + 1)(x - 3) / (x - 2)
- Vertical Asymptote: x = 2
- Horizontal Asymptote: y = 1 (because the degrees of the numerator and denominator are equal and the ratio of the leading coefficients is 1)
- x-intercepts: x = -1, x = 3
- y-intercept: (0, 3/2)
- Removable Discontinuities: None
Example 3: f(x) = (x² - 4) / (x - 2)
- Vertical Asymptote: None (after simplification)
- Oblique Asymptote: None (after simplification)
- x-intercept: x = -2
- y-intercept: (0, 2)
- Removable Discontinuity: Hole at x = 2 (because (x-2) cancels)
Advanced Considerations
-
Multiplicity of Roots: The multiplicity of a root (zero of the numerator) or a vertical asymptote (zero of the denominator) affects the graph's behavior near that point. A root or asymptote with an odd multiplicity will cause the graph to cross or approach the asymptote from opposite sides. An even multiplicity will cause the graph to approach the asymptote from the same side.
-
Symmetry: Some rational functions exhibit symmetry. For example, if f(-x) = f(x), the function is even and symmetric about the y-axis. If f(-x) = -f(x), the function is odd and symmetric about the origin.
-
Domain and Range: Understanding the domain (all possible x-values) and range (all possible y-values) is essential. Vertical asymptotes restrict the domain, and horizontal/oblique asymptotes often influence the range.
By carefully analyzing these key features, you can effectively determine which graph correctly represents a given rational function. Remember that practice is key—the more rational functions you graph, the better you'll become at recognizing their unique characteristics and visualizing their graphical representations. Mastering this skill provides a solid foundation for tackling more complex mathematical concepts in your future studies.
Latest Posts
Latest Posts
-
3 Feet 6 Inches In Cm
Mar 17, 2025
-
What Is 26 Out Of 30 As A Percentage
Mar 17, 2025
-
How Many Feet Is 26 In
Mar 17, 2025
-
What Is 6 Out Of 20 As A Percentage
Mar 17, 2025
-
What Is Melting Point Of Glass
Mar 17, 2025
Related Post
Thank you for visiting our website which covers about Which Graph Represents The Rational Function . We hope the information provided has been useful to you. Feel free to contact us if you have any questions or need further assistance. See you next time and don't miss to bookmark.
