Which Table Represents A Linear Function
Kalali
Mar 16, 2025 · 6 min read
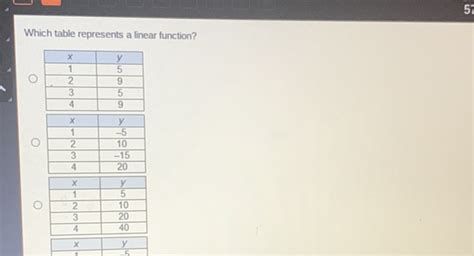
Table of Contents
Which Table Represents a Linear Function? A Comprehensive Guide
Determining whether a table of values represents a linear function is a fundamental concept in algebra. Understanding this allows you to model real-world scenarios, predict future values, and grasp the core principles of linear relationships. This comprehensive guide will equip you with the knowledge and tools to confidently identify linear functions from tabular data.
Understanding Linear Functions
Before diving into identifying linear functions from tables, let's solidify our understanding of what constitutes a linear function. A linear function is a function whose graph is a straight line. This means that the relationship between the input (independent variable, often denoted as 'x') and the output (dependent variable, often denoted as 'y') is consistent and proportional. Mathematically, a linear function can be represented in the form:
y = mx + b
Where:
- y is the dependent variable.
- x is the independent variable.
- m is the slope (representing the rate of change). A constant slope indicates a linear relationship.
- b is the y-intercept (the value of y when x = 0).
Key Characteristics of Linear Functions in Tables
When examining a table of values, several key characteristics indicate a linear function:
-
Constant Rate of Change: The most crucial characteristic is a constant rate of change between consecutive x and y values. This means that for every unit increase in x, there's a consistent change in y. This constant change is the slope (m).
-
Consistent Slope: Calculate the slope using any two pairs of points from the table. If the calculated slope remains the same for all pairs of points, it confirms a linear function. The slope formula is:
m = (y₂ - y₁) / (x₂ - x₁)
where (x₁, y₁) and (x₂, y₂) are any two points from the table.
- Straight Line Graph: If you were to plot the points from the table on a coordinate plane, they would form a perfectly straight line. This visual representation further confirms the linearity of the function.
Identifying Linear Functions: Step-by-Step Examples
Let's work through several examples to illustrate how to determine if a table represents a linear function.
Example 1: A Linear Function
| x | y |
|---|---|
| 0 | 2 |
| 1 | 5 |
| 2 | 8 |
| 3 | 11 |
| 4 | 14 |
Analysis:
-
Calculate the change in y: The y-values increase by 3 for every unit increase in x (5-2 = 3, 8-5 = 3, 11-8 = 3, 14-11 = 3).
-
Calculate the slope: Using the points (0, 2) and (1, 5): m = (5 - 2) / (1 - 0) = 3. Using the points (2, 8) and (3, 11): m = (11 - 8) / (3 - 2) = 3. The slope remains constant at 3.
-
Conclusion: The table represents a linear function with a slope of 3 and a y-intercept of 2 (when x = 0, y = 2). The equation of the line is y = 3x + 2.
Example 2: A Non-Linear Function
| x | y |
|---|---|
| 0 | 1 |
| 1 | 4 |
| 2 | 9 |
| 3 | 16 |
| 4 | 25 |
Analysis:
-
Calculate the change in y: The differences between consecutive y-values are 3, 5, 7, and 9. The change in y is not constant.
-
Calculate the slope: Using the points (0, 1) and (1, 4): m = (4 - 1) / (1 - 0) = 3. Using the points (1, 4) and (2, 9): m = (9 - 4) / (2 - 1) = 5. The slope is not constant.
-
Conclusion: The table does not represent a linear function. This is a quadratic function (y = x² + 1).
Example 3: A Linear Function with a Negative Slope
| x | y |
|---|---|
| -2 | 8 |
| -1 | 5 |
| 0 | 2 |
| 1 | -1 |
| 2 | -4 |
Analysis:
-
Calculate the change in y: The y-values decrease by 3 for every unit increase in x.
-
Calculate the slope: Using the points (-2, 8) and (-1, 5): m = (5 - 8) / (-1 - (-2)) = -3. Using the points (0, 2) and (1, -1): m = (-1 - 2) / (1 - 0) = -3. The slope is constant at -3.
-
Conclusion: The table represents a linear function with a slope of -3 and a y-intercept of 2. The equation of the line is y = -3x + 2.
Example 4: A Table that Appears Linear but Isn't
This example highlights the importance of checking all data points.
| x | y |
|---|---|
| 1 | 3 |
| 2 | 6 |
| 3 | 9 |
| 4 | 12 |
| 5 | 14 |
Analysis:
The initial impression might suggest a linear function with a slope of 3. However, notice that the last point (5, 14) doesn't fit the pattern. The difference between 12 and 14 is only 2, not 3.
Conclusion: This table does not represent a linear function because the rate of change isn't consistently 3. There's an anomaly in the data.
Advanced Considerations and Potential Pitfalls
-
Discrete vs. Continuous Data: The examples above showcase discrete data points. Linear functions can also represent continuous data, where any value within a range is possible.
-
Data Errors: Real-world data often contains errors. Minor deviations from a constant rate of change don't necessarily disqualify a dataset from being considered approximately linear. Statistical methods can help assess the degree of linearity in such cases (e.g., regression analysis).
-
Limited Data Points: With limited data points, it might be challenging to definitively conclude linearity. More data points provide a more robust assessment.
-
Non-linear Functions Mimicking Linearity (Locally): Some non-linear functions may exhibit near-linear behavior over a small interval. Careful examination across the entire range of data is necessary.
Real-World Applications
Understanding linear functions from tables is crucial in many real-world scenarios:
-
Predicting Sales: Businesses use linear models to forecast future sales based on past trends.
-
Analyzing Scientific Data: Scientists use linear relationships to model the relationship between different variables in experiments.
-
Financial Modeling: Linear functions are integral in financial models to project growth, predict returns, and assess risks.
-
Engineering and Physics: Many physical laws and engineering principles can be represented by linear equations.
Conclusion
Identifying whether a table represents a linear function involves systematically analyzing the rate of change between consecutive data points. A constant rate of change (constant slope) is the hallmark of a linear function. By applying the techniques described in this guide, you can confidently analyze tabular data and determine the presence or absence of a linear relationship. Remember to always carefully examine all data points and consider potential sources of error when interpreting results. Mastering this skill is fundamental to understanding various mathematical and real-world concepts.
Latest Posts
Latest Posts
-
In Many States Trailers With A Gvwr Of 1500
Jul 10, 2025
-
How Many Tablespoons Are In A Hidden Valley Ranch Packet
Jul 10, 2025
-
Which Is The Best Summary Of The Passage
Jul 10, 2025
-
How Many Quarts Of Soil In A Cubic Foot
Jul 10, 2025
-
What Is 3 4 Of A Pound
Jul 10, 2025
Related Post
Thank you for visiting our website which covers about Which Table Represents A Linear Function . We hope the information provided has been useful to you. Feel free to contact us if you have any questions or need further assistance. See you next time and don't miss to bookmark.