Which Table Shows A Linear Function
Kalali
Mar 12, 2025 · 6 min read
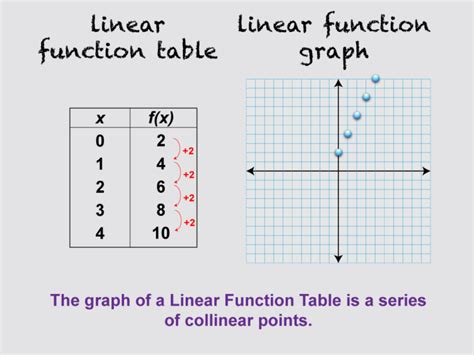
Table of Contents
Which Table Shows a Linear Function? A Comprehensive Guide
Understanding linear functions is fundamental in algebra and has wide-ranging applications in various fields. A linear function is characterized by a constant rate of change, meaning the dependent variable changes at a consistent rate for every unit change in the independent variable. This constant rate of change is represented by the slope. Identifying a linear function from a table of values requires recognizing this consistent slope. This article will delve deep into how to identify a linear function from its table representation, providing you with clear strategies, examples, and troubleshooting tips.
Understanding Linear Functions: The Basics
Before diving into table analysis, let's solidify our understanding of linear functions. A linear function can be expressed in the slope-intercept form: y = mx + b, where:
- y is the dependent variable.
- x is the independent variable.
- m is the slope (the constant rate of change).
- b is the y-intercept (the value of y when x = 0).
The key characteristic of a linear function is its constant slope. This means that for every unit increase in x, the change in y is always the same. This constant relationship is what creates the straight line when the function is graphed.
Identifying Linear Functions from Tables: A Step-by-Step Guide
Analyzing tables to determine if they represent linear functions involves calculating the rate of change between consecutive data points. If this rate of change remains constant throughout the table, then the table represents a linear function. Here's a step-by-step guide:
Step 1: Calculate the Change in y (Δy)
For each consecutive pair of data points, calculate the difference in the y-values. This represents the change in the dependent variable. We denote this as Δy (Delta y).
Step 2: Calculate the Change in x (Δx)
Similarly, calculate the difference in the x-values for each consecutive pair of data points. This represents the change in the independent variable. We denote this as Δx (Delta x).
Step 3: Calculate the Rate of Change (Slope)
The rate of change, or slope (m), is calculated by dividing the change in y (Δy) by the change in x (Δx): m = Δy / Δx.
Step 4: Analyze the Results
If the calculated slope (m) remains constant for all consecutive pairs of data points in the table, then the table represents a linear function. If the slope varies, the table does not represent a linear function.
Examples: Identifying Linear and Non-Linear Functions from Tables
Let's illustrate the process with examples.
Example 1: Linear Function
Consider the following table:
| x | y |
|---|---|
| 1 | 3 |
| 2 | 5 |
| 3 | 7 |
| 4 | 9 |
Calculations:
- Between (1, 3) and (2, 5): Δy = 5 - 3 = 2; Δx = 2 - 1 = 1; m = 2/1 = 2
- Between (2, 5) and (3, 7): Δy = 7 - 5 = 2; Δx = 3 - 2 = 1; m = 2/1 = 2
- Between (3, 7) and (4, 9): Δy = 9 - 7 = 2; Δx = 4 - 3 = 1; m = 2/1 = 2
Conclusion: The slope (m) is consistently 2. Therefore, this table represents a linear function. The equation of this line would be y = 2x + 1.
Example 2: Non-Linear Function
Now consider this table:
| x | y |
|---|---|
| 1 | 1 |
| 2 | 4 |
| 3 | 9 |
| 4 | 16 |
Calculations:
- Between (1, 1) and (2, 4): Δy = 4 - 1 = 3; Δx = 2 - 1 = 1; m = 3/1 = 3
- Between (2, 4) and (3, 9): Δy = 9 - 4 = 5; Δx = 3 - 2 = 1; m = 5/1 = 5
- Between (3, 9) and (4, 16): Δy = 16 - 9 = 7; Δx = 4 - 3 = 1; m = 7/1 = 7
Conclusion: The slope varies (3, 5, and 7). Therefore, this table does not represent a linear function. This is a quadratic function, where the relationship between x and y is not constant.
Dealing with Irregular Intervals in x-values
The examples above used tables with consistent intervals in the x-values (increments of 1). However, you'll often encounter tables with irregular intervals. The process remains the same; you calculate the slope for each pair of consecutive data points.
Example 3: Linear Function with Irregular x-intervals
| x | y |
|---|---|
| 1 | 2 |
| 3 | 6 |
| 5 | 10 |
| 7 | 14 |
Calculations:
- Between (1, 2) and (3, 6): Δy = 6 - 2 = 4; Δx = 3 - 1 = 2; m = 4/2 = 2
- Between (3, 6) and (5, 10): Δy = 10 - 6 = 4; Δx = 5 - 3 = 2; m = 4/2 = 2
- Between (5, 10) and (7, 14): Δy = 14 - 10 = 4; Δx = 7 - 5 = 2; m = 4/2 = 2
Conclusion: Even with irregular x-intervals, the slope remains constant at 2. This table represents a linear function.
Advanced Considerations: Non-Linear Relationships Masquerading as Linear
It's crucial to be aware that some non-linear relationships might initially appear linear if you only examine a small portion of the data. Always check multiple intervals within the table to ensure consistency. A non-linear function may show a seemingly constant slope over a limited range, but this will break down as you consider more data points.
Practical Applications of Identifying Linear Functions
The ability to identify linear functions from tables has numerous practical applications across diverse fields:
- Science: Analyzing experimental data to determine if a relationship between two variables is linear. For example, examining the relationship between force and acceleration.
- Finance: Modeling simple interest calculations, where the interest earned is linearly proportional to the principal amount and time.
- Engineering: Determining the linear relationship between stress and strain in materials.
- Economics: Analyzing supply and demand curves (often approximated as linear within a certain range).
- Computer Science: Developing linear algorithms and data structures.
Troubleshooting Tips
- Careful Calculations: Double-check your arithmetic to avoid errors in calculating Δy, Δx, and the slope.
- Consistent Units: Ensure that your data points are using consistent units. Inconsistency can lead to inaccurate slope calculations.
- Visual Inspection: After calculating the slopes, plot the data points on a graph. A visual inspection can help confirm if the data points fall on a straight line, further supporting your conclusion about linearity.
- Consider the Context: The context of the data is vital. Even if the data appears linear, the underlying relationship might be non-linear. A thorough understanding of the problem domain is essential for accurate interpretation.
Conclusion
Identifying whether a table represents a linear function is a fundamental skill in mathematics and data analysis. By systematically calculating the rate of change between data points, you can confidently determine whether the relationship is linear and, if so, derive its equation. Remember to carefully check your calculations, consider the context of the data, and be aware of potential non-linear relationships that might appear linear over a limited range. Mastering this skill provides a strong foundation for tackling more complex mathematical and analytical problems.
Latest Posts
Latest Posts
-
R C Cola And A Moon Pie
Jul 04, 2025
-
If I Was 18 What Year Would I Be Born
Jul 04, 2025
-
One And Three Hundred Twenty Four Thousandths
Jul 04, 2025
-
How Much Is 2 Pounds Of Cream Cheese
Jul 04, 2025
-
How Do You Pronounce M I C H A L
Jul 04, 2025
Related Post
Thank you for visiting our website which covers about Which Table Shows A Linear Function . We hope the information provided has been useful to you. Feel free to contact us if you have any questions or need further assistance. See you next time and don't miss to bookmark.