Back To Back Stem And Leaf
Kalali
Mar 28, 2025 · 6 min read
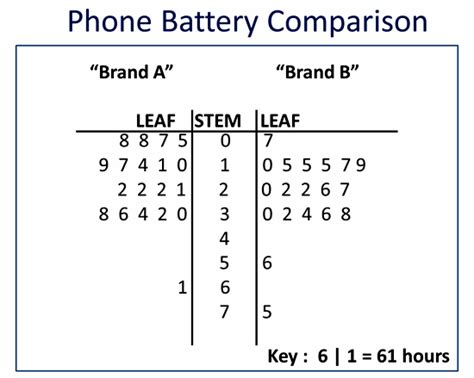
Table of Contents
Back-to-Back Stem and Leaf Plots: A Comprehensive Guide
Stem-and-leaf plots are a fantastic way to visualize and analyze data, especially when dealing with smaller datasets. They offer a clear picture of the data's distribution, allowing for quick identification of patterns, outliers, and central tendencies. But what happens when you need to compare two datasets simultaneously? That's where the back-to-back stem-and-leaf plot comes in. This powerful tool allows for a direct and efficient comparison of two related datasets, revealing similarities and differences at a glance. This comprehensive guide will delve deep into the creation, interpretation, and applications of back-to-back stem-and-leaf plots.
Understanding Stem-and-Leaf Plots: A Foundation
Before diving into back-to-back plots, let's solidify our understanding of the fundamental stem-and-leaf plot. A stem-and-leaf plot is a visual representation of data that organizes data points into "stems" and "leaves." The stem represents the leading digit(s) of a data point, while the leaf represents the trailing digit(s).
Example:
Let's say we have the following data representing the scores of students on a test: 78, 82, 85, 91, 95, 72, 88, 90, 80, 75.
A stem-and-leaf plot for this data would look like this:
Stem | Leaf
-----|-----
  7  | 2 5 8
  8  | 0 2 5 8
  9  | 0 1 5
Here:
- Stem: Represents the tens digit (7, 8, 9).
- Leaf: Represents the units digit (2, 5, 8, etc.).
This simple representation allows us to quickly see the distribution of the scores. We can easily identify the range, the mode (most frequent score), and potential outliers.
Constructing a Back-to-Back Stem-and-Leaf Plot
A back-to-back stem-and-leaf plot extends the concept by placing two sets of leaves on either side of a common stem. This allows for a direct comparison of the two datasets.
Steps:
-
Identify the Stems: Determine the appropriate stems for both datasets. Ideally, use the same stems for both to facilitate easy comparison. You might need to adjust the stems to accommodate the ranges of both datasets.
-
Arrange the Leaves: For each data point in the first dataset, identify its stem and place its leaf on the right side of the stem. Do the same for the second dataset, but place the leaves on the left side of the stem. Ensure the leaves are arranged in ascending order from the stem.
-
Create the Plot: Draw a vertical line representing the stem. Arrange the leaves on either side, creating a mirror-like structure. Include a key to explain the representation (e.g., "7|2 represents 72").
Example:
Let's compare the test scores of two classes, Class A and Class B:
Class A: 78, 82, 85, 91, 95, 72, 88, 90, 80, 75 Class B: 65, 70, 73, 78, 81, 85, 92, 98, 75, 80
The back-to-back stem-and-leaf plot would look like this:
Class B         | Stem |         Class A
-----------------|------|-----------------
       5 0 3     |  7  |     2 5 8
       8 5 0     |  8  |     0 2 5 8
       2 8       |  9  |     0 1 5
      6            |  6  |
Key: 7|2 represents 72
Interpreting a Back-to-Back Stem-and-Leaf Plot
The beauty of a back-to-back stem-and-leaf plot lies in its simplicity and effectiveness in comparing datasets. We can easily observe:
-
Central Tendency: Compare the median, mean, and mode of both datasets. Notice where the data clusters around the stem. A significant shift in the central tendency indicates a difference in the average values.
-
Spread: Observe the range and the overall spread of the data for each dataset. A wider spread might suggest greater variability in one dataset compared to the other.
-
Symmetry and Skewness: Assess whether the data is symmetrically distributed around the stem or skewed to one side (left or right). Skewness reveals whether there are more extreme values on one end of the distribution.
-
Outliers: Identify data points that lie significantly far from the rest of the data. These outliers can be influential in the overall interpretation and might warrant further investigation.
Advantages of Using Back-to-Back Stem-and-Leaf Plots
-
Visual Comparison: The side-by-side structure allows for an immediate visual comparison of the two datasets. Differences and similarities become readily apparent.
-
Simplicity: They are easy to create and understand, even for those without a strong statistical background.
-
Data Retention: Unlike some other graphical representations, the stem-and-leaf plot retains the actual data values, allowing for further analysis if needed.
-
Efficiency: It's a space-saving and efficient method for comparing two datasets, especially when dealing with smaller to moderately sized datasets.
When to Use Back-to-Back Stem-and-Leaf Plots
Back-to-back stem-and-leaf plots are particularly useful when:
-
Comparing Two Related Groups: Comparing test scores of two classes, comparing the heights of male and female students, or comparing the performance of two different products.
-
Illustrating Differences: Effectively showcases the differences in the distribution, central tendency, and spread between two related datasets.
-
Small to Moderate Datasets: Best suited for datasets that are not excessively large. For very large datasets, other visualization techniques might be more appropriate.
-
Quick Analysis: Offers a quick and insightful overview of the data, facilitating quick decision-making or further investigation.
Limitations of Back-to-Back Stem-and-Leaf Plots
-
Large Datasets: They become cumbersome and less effective with very large datasets. The leaves can become cluttered and difficult to interpret.
-
Complex Data: They are not suitable for datasets with many variables or for representing complex relationships between variables. More sophisticated techniques are needed for complex data analysis.
-
Decimal Data: Handling decimal data requires careful consideration and might necessitate adjustments to the stem and leaf representation.
-
Categorical Data: Stem-and-leaf plots are designed for numerical data. Categorical data requires different visualization methods.
Beyond the Basics: Advanced Applications and Considerations
While the basic structure of a back-to-back stem-and-leaf plot is straightforward, some advanced techniques can enhance its utility:
-
Data Transformation: If the data has a wide range or significant outliers, consider transformations like logarithmic or square root transformations to improve the visualization and interpretation.
-
Multiple Datasets: While primarily designed for two datasets, with careful planning and layout, you might be able to adapt the approach for comparing three or more datasets, albeit with increased complexity.
-
Combined with Other Techniques: Stem-and-leaf plots can be effectively combined with other descriptive statistics, such as calculating the mean, median, and standard deviation, to provide a more comprehensive data analysis. Consider using a box plot alongside the stem and leaf plot for a broader perspective.
Conclusion
Back-to-back stem-and-leaf plots are a valuable tool in exploratory data analysis, particularly when comparing two related datasets. Their simplicity, effectiveness in visualizing data distributions, and ability to highlight key differences make them a practical choice for various applications. While they have limitations, particularly with very large or complex datasets, their usefulness in providing a quick and insightful overview of comparative data should not be underestimated. Understanding their strengths and limitations will help you determine when this technique is the most appropriate choice for your data analysis needs. By mastering the construction and interpretation of these plots, you can enhance your ability to effectively communicate data insights and make data-driven decisions.
Latest Posts
Latest Posts
-
Is The Transfer Of Energy By Electromagnetic Waves
Mar 31, 2025
-
Is Carbon Dioxide Gas A Pure Substance
Mar 31, 2025
-
How Many Cm Is 31 Inches
Mar 31, 2025
-
Ironing A Shirt Is An Example Of
Mar 31, 2025
-
How Much Is 20 Of 500
Mar 31, 2025
Related Post
Thank you for visiting our website which covers about Back To Back Stem And Leaf . We hope the information provided has been useful to you. Feel free to contact us if you have any questions or need further assistance. See you next time and don't miss to bookmark.
